FIGURE 4:
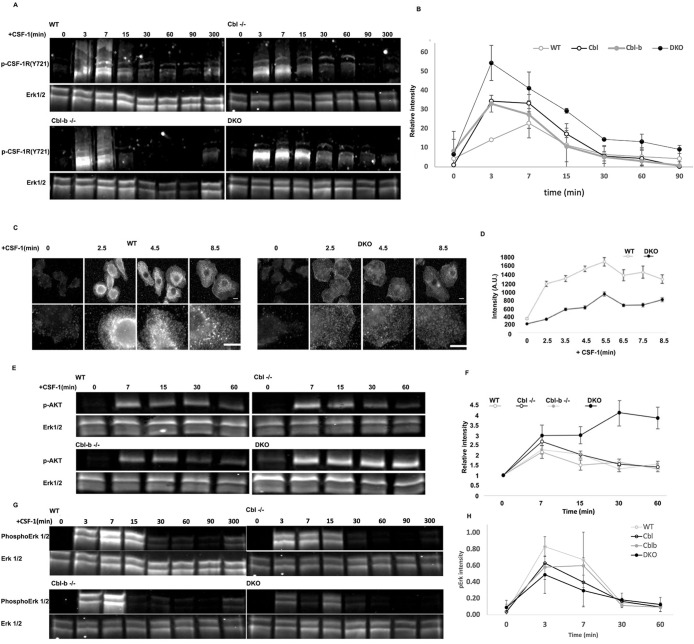
Cbl and Cbl-b limit CSF-1R and AKT phosphorylation while supporting Erk1/2 and broad tyrosine phosphorylation. (A) Immunoblot of CSF-1R phosphorylation (pY721) following CSF-1 stimulation for 0−300 min. Note the higher molecular weight products consistent with ubiquitination observed in all blots except DKO. (B) Quantification of the phospho-CSF-1R signal intensity from three immunoblots (all molecular weights of CSF-1R), normalized to total Erk1/2 (mean+/– std. dev.) (C and D) Immunofluorescence and quantification of pan phosphotyrosine in WT and DKO BMDM following CSF-1 stimulation, illustrated broadly impaired tyrosine phosphorylation in the DKO. Error bar is standard error of mean, n = 50 cells per genotype. (E) AKT(S473) phosphorylation following CSF-1 stimulation. (F) Quantification of pAKT(S473), mean+/-std. dev. from two independent experiments. (G) Western blot of Erk1/2 phosphorylation following CSF-1 stimulation. (H) Quantification of pErk (mean +/- std. dev., n = 3 experiments).

