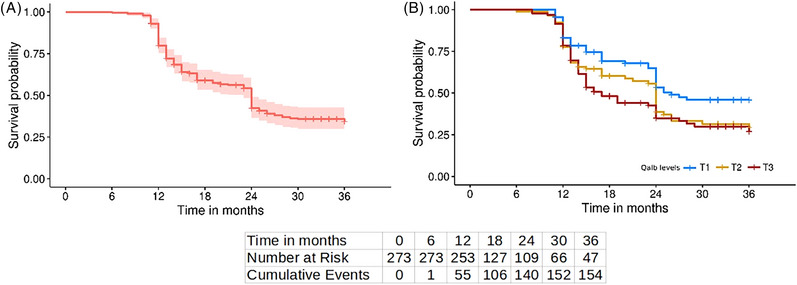
FIGURE 4.

Survival curve of sample. Both survival curves show likelihood of cognitive decline progression within follow‐up, as an increment in GFS and/or CDR scales. (A) Survival curve of sample, where light red shade represents 95% confidence intervals, and vertical lines are censored patients. (B) Same survival curve by Qalb levels, split into tertiles (T1, blue; T2, yellow; and T3, red). At bottom of both figures are the number of patients at risk of progression at the beginning of each time point and the cumulative number of events at the end of the same time point.
