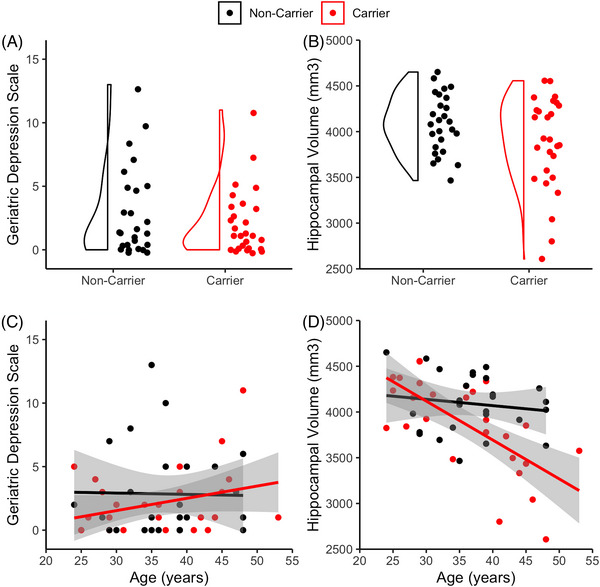
FIGURE 1.

Depressive symptoms and hippocampal volume in PSEN1 carriers and non‐carriers. Distribution of (A) Geriatric Depression Scale scores and (B) normalized hippocampal volume by group. Scatterplot with estimated regression line and standard error bands of (C) Geriatric Depression Scale scores and (D) normalized hippocampal volume by age in carriers (red) and non‐carriers (black). PSEN1, presenilin‐1
