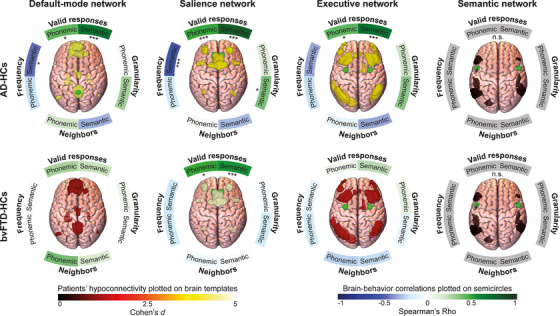
FIGURE 5.

Resting‐state fMRI connectivity results. Brain network masks plotted on brain templates reflect comparison of connectivity between patients and healthy controls in the default‐mode, salience, executive, and semantic network, colored by the effect size of the difference (Cohen's d). Both patient groups presented hypoconnectivity in the default‐mode, salience, and executive networks. Semicircles around brain templates reflects correlations between networks’ connectivity strength and fluency measures, with asterisks indicating the p‐value (*** p < 0.001; ** p < 0.01; * p < 0.05) and color indicating correlation strength (Pearson's or Spearman's Rho, as required by data distribution). In the AD‐HC analysis, valid responses in the phonemic and semantic tasks positively correlated with connectivity of the default‐mode, salience, and executive networks. Frequency in the semantic task negatively correlated with connectivity of the default‐mode and salience networks. Granularity in the semantic task positively correlated with connectivity of the salience network. Last, in the bvFTD‐HC analysis, valid responses in the phonemic and semantic tasks positively correlated with connectivity of the salience network. AD, Alzheimer's dementia; bvFTD, behavioral variant frontotemporal dementia; fMRI, functional magnetic resonance imaging; HC, healthy control; n.s., non‐significant difference
