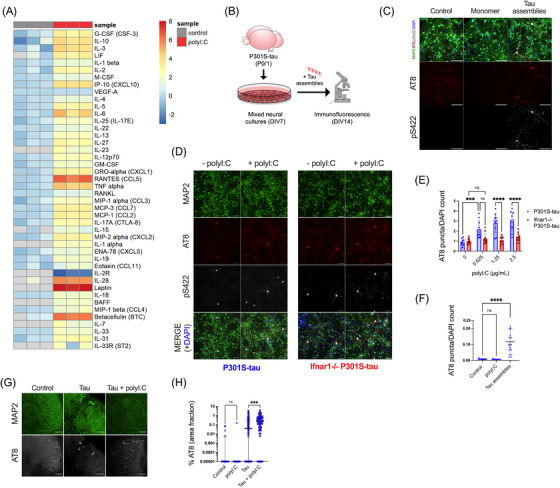
FIGURE 1.

PolyI:C drives seeded tau aggregation in a type‐I IFN‐dependent manner. Mixed neural cultures were prepared from P301S‐tau transgenic mice. (A) Cytokines were measured in the supernatant of cultures treated repetitively with polyI:C (2.5 μg/mL) and compared to control untreated cultures; n = 3. Data presented are the log2 of cytokine concentration (pg/mL), which was normalized to the average of control concentrations. (B) Schematic of tau seeding assay in primary mixed neural cultures from P0/P1 mouse brain overexpressing human P301S‐tau. Recombinant tau assemblies were added at DIV7, and tau aggregation was monitored by immunofluorescence microscopy using antibody AT8 or pS422 at DIV14. (C) Tau monomer and assemblies (50 nM) were added to cultures and levels of AT8 and pS422 reactivity measured by immunofluorescence. (D, E) Seeded aggregation in Ifnar1 +/+ P301S‐tau and Ifnar1 −/− P301S‐tau cultures treated with/without polyI:C (2.5 μg/mL) and tau assemblies (50 nM); n = 5, N = 2 independent experiments. (F) Levels of tau aggregation in Ifnar1 +/+ P301S‐tau cultures treated with polyI:C (2.5 μg/mL) alone or tau assemblies (50 nM) alone; n = 5, N = 3 independent experiments. (G) Representative images of seeded tau aggregation in OHSCs from P301S‐tau mice treated with tau assemblies (‘Tau’) (300 nM) ± polyI:C (10 μg/mL) and stained with AT8. (H) Quantification of seeded tau aggregation measured by immunofluorescence; slices from N = 6 mice. n = wells/condition, each containing 30,000 plated cells. All error bars indicate mean ± SD, except for H, where median and interquartile range are presented. Scale bars = 100 μm. Significance calculated by two‐way ANOVA for E and Kruskal–Wallis test with Dunn's correction for F and H. ***p < 0.001; ****p < 0.0001; ns, not significant.
