
FIGURE 3.
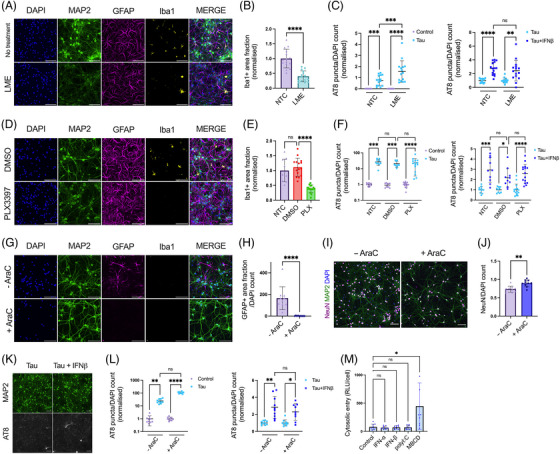
IFN‐I vulnerability is intrinsic to neurons. (A) Fluorescence microscope images of mixed neural cultures from Ifnar1 +/+ P301S‐tau transgenic mice (P0/P1) treated with L‐leucine methyl ester (LME, 15 mM for 4 h) revealing reduction of Iba1 positive cell populations. (B) The Iba1+ area fraction was quantified in untreated (NTC) and LME‐treated cultures; n = 5, N = 3 independent experiments. (C) Seeded tau aggregation was quantified in untreated or LME‐treated Ifnar1 +/+ P301S‐tau cultures, seeded with tau assemblies (50 nM) ± IFN‐β (50 U/mL); n = 5, N = 3 independent experiments. (D) Cultures from Ifnar1 +/+ P301S‐tau mice treated with DMSO or PLX3397 (PLX, 2 μM) revealing reduction of Iba1‐positive cell populations. (E) The Iba1+ area fraction was quantified in untreated and DMSO or PLX3397‐treated cultures; n = 5, N = 3 independent experiments. (F) Seeded tau aggregation was quantified in untreated or PLX3397‐treated Ifnar1 +/+ P301S‐tau cultures, seeded with tau assemblies (25 nM) ± IFN‐β (50 U/mL); n = 5, N = 3 independent experiments. (G) Cortical/hippocampal neuronal cultures were prepared from Ifnar1 +/+ P301S‐tau mice at E15.5 using a papain‐based protocol. Addition of cytosine arabinoside (AraC, 1 μM) at DIV0/5/7 revealed a complete ablation of GFAP+ cell populations and an absence of Iba1+ cells. (H) The GFAP+ area fraction was quantified in untreated and AraC‐treated cultures; n = 5, N = 3 independent experiments. (I) Representative images of NeuN staining at DIV12. (J) The number of NeuN+ nuclei was quantified by image analysis and values are presented normalized to the DAPI count; n = 10 from n = 2 independent plates. (K) Representative images and (L) quantification of seeded tau aggregation in AraC treated Ifnar1 +/+ P301S‐tau neuronal cultures, seeded with tau assemblies (20 nM) on DIV6 and treated with/without IFN‐β (25 U/mL), with fixation at DIV12; n = 10, n = 2 independent plates. (M) Tau entry assay in primary mixed neural cultures from Ifnar1 +/+ P301S‐tau mice. Cultures were infected with hSyn::‐eGFP‐P2A‐LgBiT‐NLS and treated overnight at DIV6 with polyI:C (2.5 μg/mL), IFN‐α, IFN‐β (both 50 U/mL), or methyl‐β‐cyclodextrin (MBCD), (2 mM) for 2 h on DIV7. Cytosolic entry of tau was quantified by luminescence intensity 1 h after addition of tau‐HiBiT assemblies to the medium. Cytosolic entry was normalized to the number of viable cells per well; n = 3, N = 3 independent experiments. n = wells/condition, each containing 30,000 plated cells. All error bars indicate mean ± SD. Scale bars = 100 μm. Significance calculated by Mann–Whitney test for B, H and J and Kruskal–Wallis test with Dunn's correction for C, E, F, L and M. *p < 0.05; **p < 0.01; ***p < 0.001; ****p < 0.0001; ns, not significant.