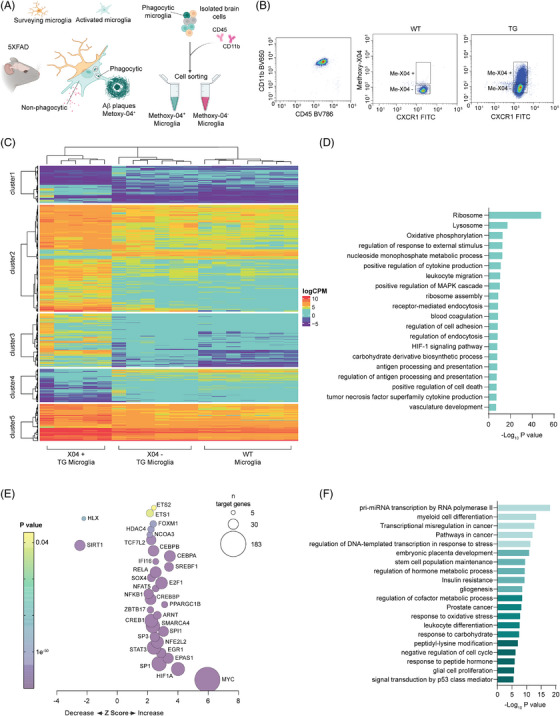
FIGURE 1.

Phagocytic microglial activation primes changes in gene expression in Alzheimer's mice. (A) Schematic representation of the experimental design. Six‐month old Alzheimer's disease (AD) 5xFAD mice were injected with permeable amyloid deposit staining fluorescent probe Methoxy‐X04 (Me‐X04) before microglia fluorescent activated cell sorting (FACS) cell sorting with Cd11b and Cd45 markers. Phagocytic microglia (Me‐X04 positive) were separated by non‐phagocytic (Me‐X04 negative) and sequenced to detect differential expression of transcripts. (B) Representative plot of FACS sorting of 10.000 events of the microglia double positive population (Cd11b, Cd45) divided for Me‐X04 positivity. (C) Heat map of logCPM of detected transcripts between murine Alzheimer's phagocytic microglia ( TG Me‐X04+), Alzheimer's non‐phagocytic (TG Me‐X04−) and wild‐type (WT) (n = 6 TG and 7 WT animals as biological replicates, hierarchal clustering performed using Ward's least absolute error with Manhattan distance). (D) Bar plot of functional enrichment analysis top 20 significant Metascape clusters performed on differentially expressed transcripts in phagocytic versus non‐phagocytic AD microglia. (E) Bubble plot of Ingenuity pathway analysis (IPA) of upstream regulators (transcription factors) based on differentially expressed genes between phagocytic versus non‐phagocytic AD microglia obtained through RNA‐seq. Z‐score indicates IPA prediction of pathway activation (positive value) or inhibition (negative value) in phagocytic microglia. Color bar expresses p‐value significancy (yellow to purple), size expresses the number of genes contained in the pathway (|z | > 2 is considered significant, pathway containing > 10 genes were included). (F) Bar plot of functional enrichment analysis top 20 significant Metascape clusters performed on differentially expressed transcription factors in phagocytic AD versus non‐phagocytic microglia.
