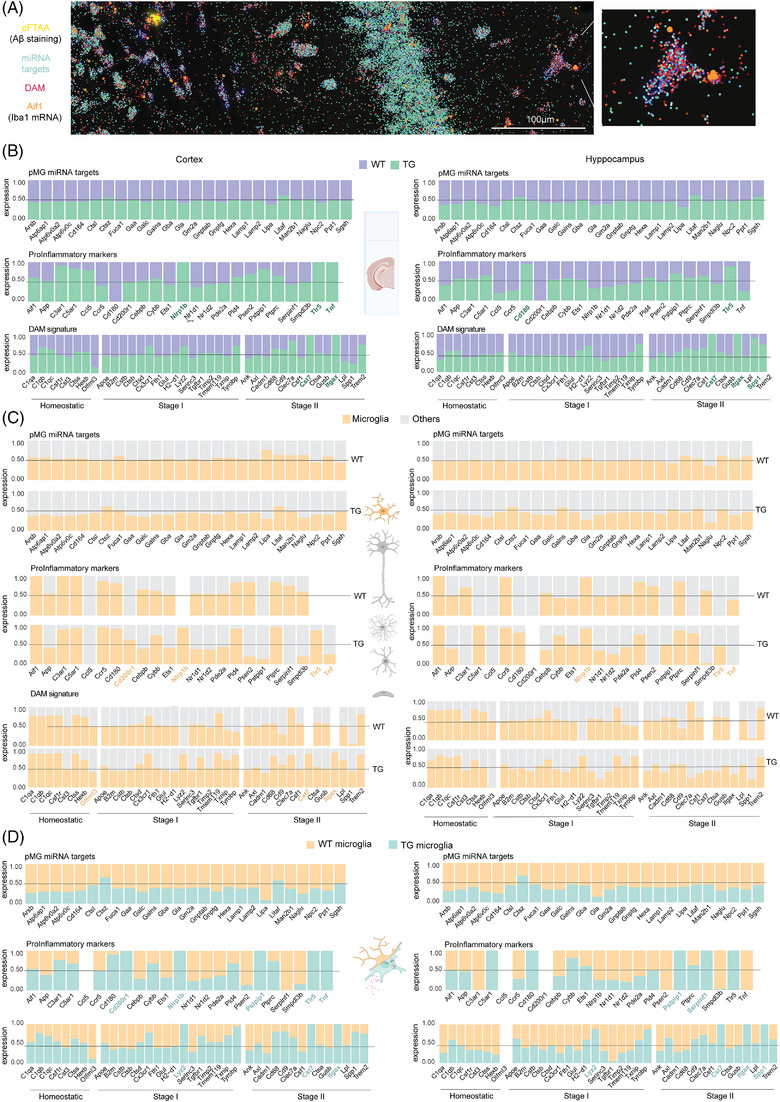
FIGURE 4.

Spatial analysis of microRNA (miRNA) phagocytic targets and disease‐associated microglia (DAM) and pro‐inflammatory signature. (A) Representative image of spatial sequencing of 5xFAD brain slices. In yellow, the staining of Aβ aggregates with pFTAA; shades of red represent the selected list of DAM genes; and in shades of blue, the miRWalk targets involved in phagocytosis. In orange, Aif1 (Iba1 coding gene) expression identifying microglia cells representatively outlined in the zoom. (B) Stacked bar plot with the average expression of miRWalk, DAM, and pro‐inflammatory genes (Supplementary Table S2) overall in 5XFAD Alzheimer's disease (AD) slices (green) with respect to wild‐type (WT) animals (purple) in cortex (left) and hippocampi (right) obtained from the spatial sequencing analysis. In green, the genes markers discussed (n = 2 WT and 3 transgenic [TG] animals as biological replicates). (C) Stacked bar plot with the average expression of miRWalk, DAM and pro‐inflammatory gene lists (Supplementary Table S2) in microglial cells (yellow, Aif1 positive cells) in respect of all the other cell types (gray, Aif1 negative) in cortex (left) and hippocampi (right) obtained from the spatial sequencing analysis. In yellow, the genes markers discussed (n = 2 WT and 3 TG animals as biological replicates). (D) Stacked bar plot with the average expression of miRWalk, DAM, and pro‐inflammatory gene lists (Supplementary table S2) in microglial Aif1 positive Alzheimer's disease cells (blue) in respect of WT microglia (yellow) in cortex (left) and hippocampi (right) obtained from the spatial sequencing analysis. In blue, the genes markers discussed (n = 2 WT and 3 TG animals as biological replicates).
