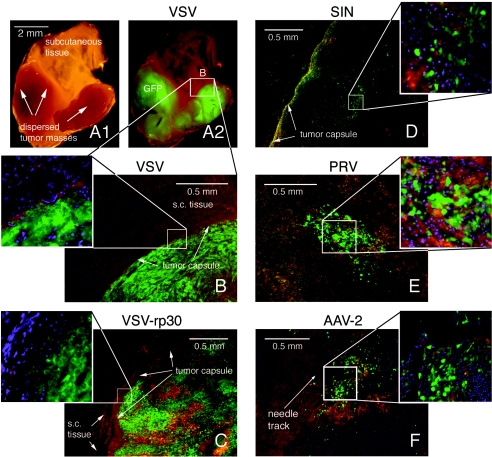
FIG. 8.
Virus infection of glioblastoma xenografts in vivo. Images of tumor sections were taken using a multichannel fluorescence filter. Green indicates GFP expression, blue indicates nuclei stained with DAPI, and red-brown areas mark tissue background. (A1) Macroscopic aspect of a tissue block containing two small tumor masses that were remote from the original site of VSV injection. (A2) At 10 dpi, VSV selectively infected the small tumor masses. (B) Microscopic image of tumor mass shown in A. Note the demarcation at the tumor capsule. (C) At 10 days after intratumoral injection, VSV-rp30 has infected the whole tumor mass without crossing the tumor border (inset). (D) Intratumoral injection of SIN led to multiple widespread green islands and a distinct subcapsular green fluorescent band, indicating active viral spread. (E) Intratumoral injection with PRV at 10 dpi. The central area of the tumor is depicted. A similar spread was seen at 3 dpi. (F) Diffusion control with replication deficient AAV2. GFP expression was restricted to a 0.5-mm radius around the needle track.

