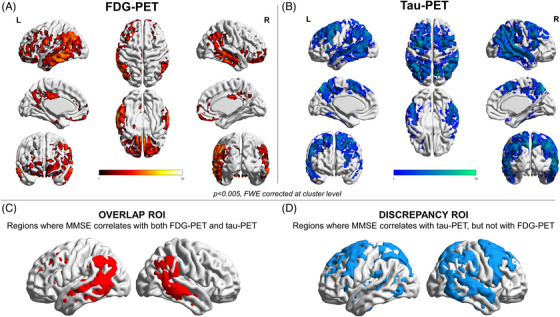
FIGURE 1.

Voxel‐wise correlation between baseline MMSE and PET neuroimaging. Panels A and B show the voxel‐wise correlation results with MMSE for brain metabolism and tau uptake, respectively. Thresholded SPM images (p < 0.005 FWE‐corrected at the cluster level, minimum cluster extent k = 100 voxels) are over‐imposed on a standard ICBM152 surface with BrainNet Viewer. Panels C and D show the binary masks including the voxel correlating with MMSE for both brain metabolism and tau uptake (overlap ROI, C), and the ones correlating only with tau uptake (discrepancy ROI, D).
