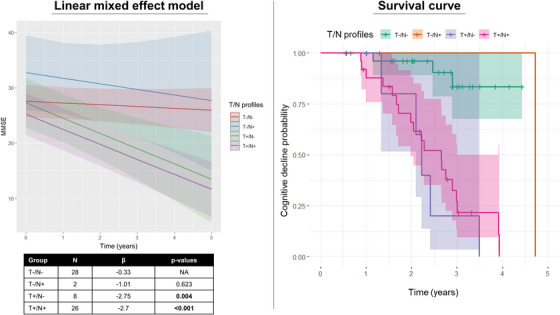
FIGURE 4.

Longitudinal results. Panel A shows different cognitive trajectories of MMSE scores over time in the different T/N categories, where N is defined based on FDG‐PET and T on tau‐PET. Panel B shows survival curves in relation to declining or not in MMSE in the different T/N categories, where N is defined based on FDG‐PET and T on tau‐PET.
