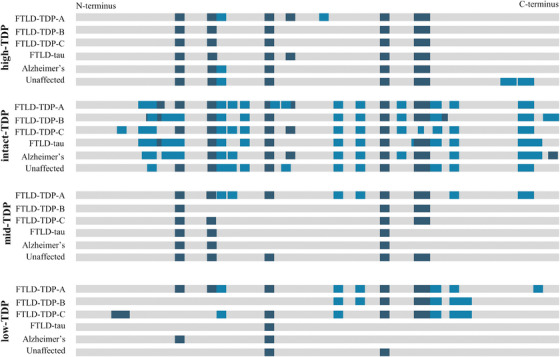
FIGURE 2.

Sequence coverage of TDP‐43 in pooled brain tissue subjected to molecular weight fractionation by gel electrophoresis followed by high‐resolution mass spectrometric analysis. Gray bar represents the sequence of full‐length TDP‐43 (residues 1‐414) with proteolytic peptides detected using trypsin (dark blue) and chymotrypsin (light blue)
