FIGURE 3.

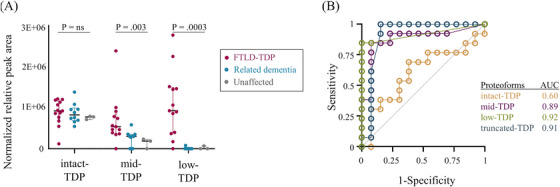
In the biomarker discovery phase, low‐TDP and mid‐TDP proteoforms distinguished FTLD‐TDP from controls as demonstrated by (A) normalized relative peak area and (B) receiver operating characteristics curve analysis

In the biomarker discovery phase, low‐TDP and mid‐TDP proteoforms distinguished FTLD‐TDP from controls as demonstrated by (A) normalized relative peak area and (B) receiver operating characteristics curve analysis