
Fig. 2 |. Endocytosis and re-elimination of the PEGylated AuNPs by PTECs in vivo.
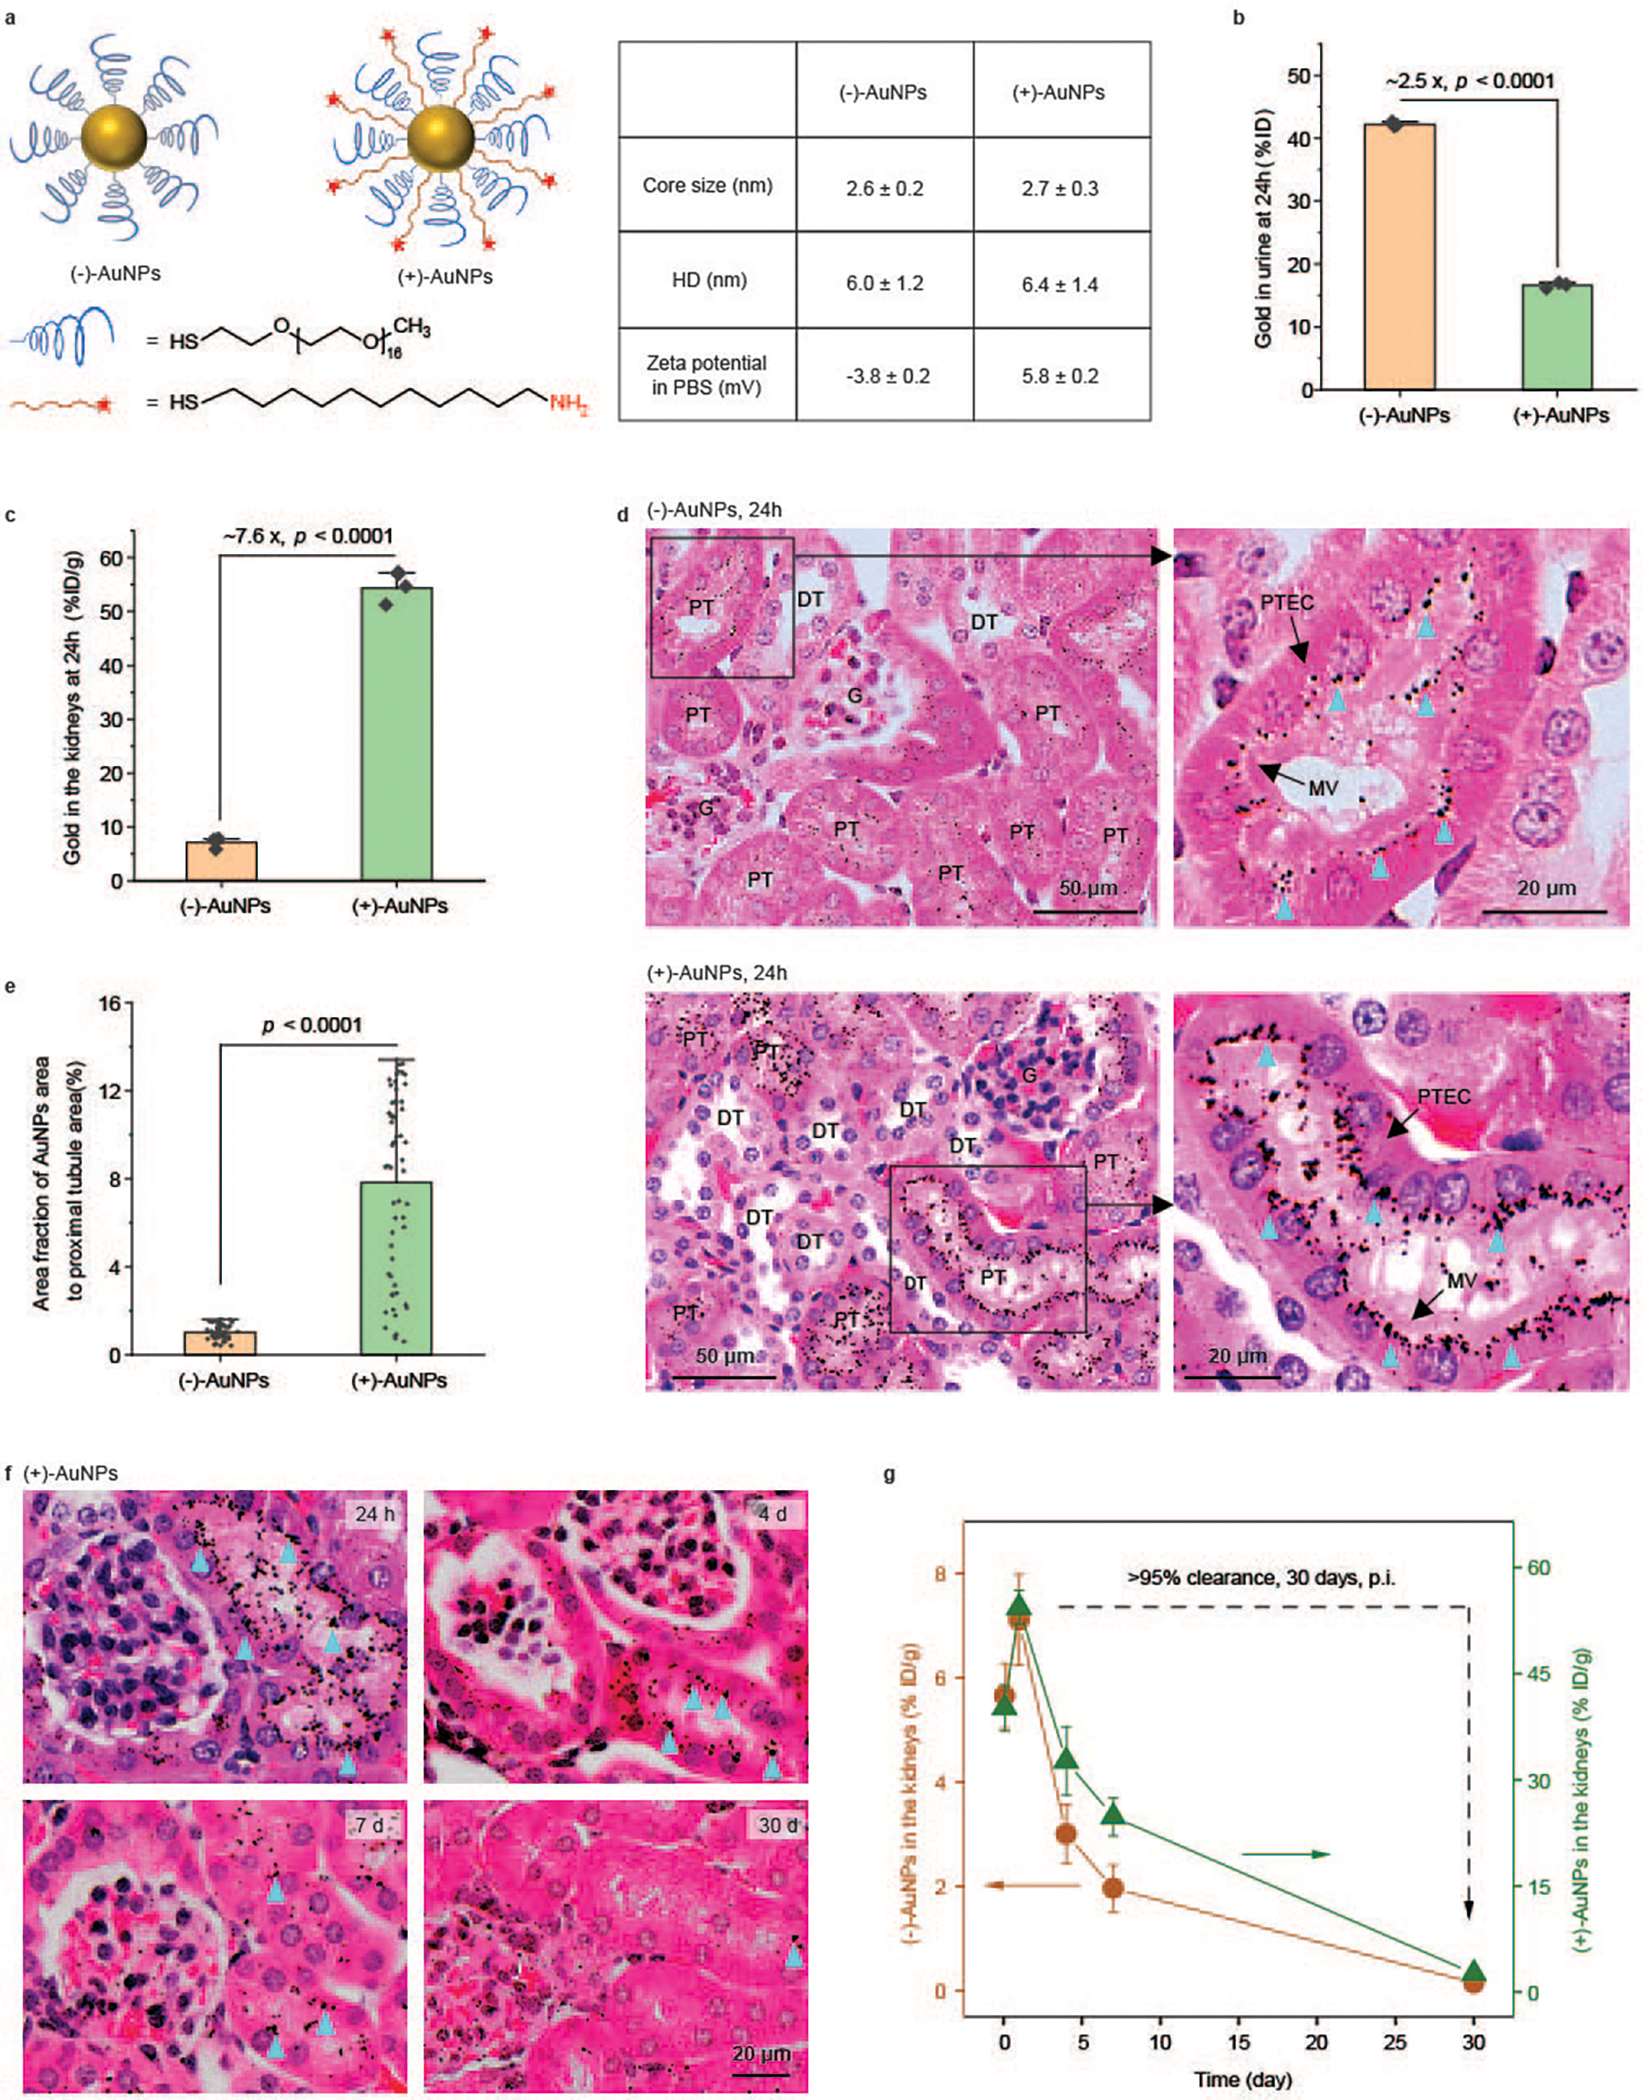
a, Design and characterizations of (−)-AuNPs and (+)-AuNPs via coating AuNPs with PEG methyl ether thiol (Molecular weight, 800 Da) or PEG methyl ether thiol together with amine-terminated positively charged 11-amino-1-undecanethiol. HD, hydrodynamic diameters. b, Quantification of the amount of gold in the urine collected at 24 h p.i. of the AuNPs, which was measured by ICP-MS. P = 4.54 × 10⁻⁷. N = 3 mice for each group. c, Quantification of the amount of gold in the kidneys harvested at 24 h p.i. of the AuNPs, measured with ICP-MS. P = 3.86 × 10⁻⁴. N = 3 mice for each group. d, Representative images of silver-enhanced and hematoxylin and eosin (H&E)-stained tissue sections of the kidneys obtained at 24 h p.i. of (−)-AuNPs (upper) and (+)-AuNPs (lower). Silver-enhanced AuNPs are indicated by blue triangles. The righthand images show zoomed-in views of the areas in the boxes. G, glomerulus; DT, distal tubules; MV, microvilli. e, Quantification of the area fraction of silver-enhanced AuNPs in the entire cross-section of a PT. P = 3.50 × 10⁻¹⁸. N = 60 and 59 PT cross-sections for (−)-AuNPs and (+)-AuNPs, respectively. f, Representative images of silver-enhanced and H&E-stained kidney tissue sections at 24 h, 4 days, 7 days and 30 days p.i. of (+)-AuNPs. Silver-enhanced AuNPs are indicated by blue triangles. g, The amount of gold in the kidneys was measured with ICP-MS at different time points (2 h, 24 h, 4 days, 7 days and 30 days) after injection of (+)-AuNPs (green line) and (−)-AuNPs (orange line). Over 95% (that is, ((Amount at 24 h – Amount at 30 days)/Amount at 24 h) × 100%) of accumulated AuNPs were eliminated out of the kidneys within one month. N = 3 mice for each time point. Data are presented as mean ± s.d. (standard deviation) in b, c, e and g. Two-sided Student’s t-test was performed at the 0.05 significance level in b, c and e. Representative images are presented out of images acquired from three independent samples in d and f.