
Fig. 4 |. Nanoparticle elimination by PTECs through an organelle-extrusion mechanism.
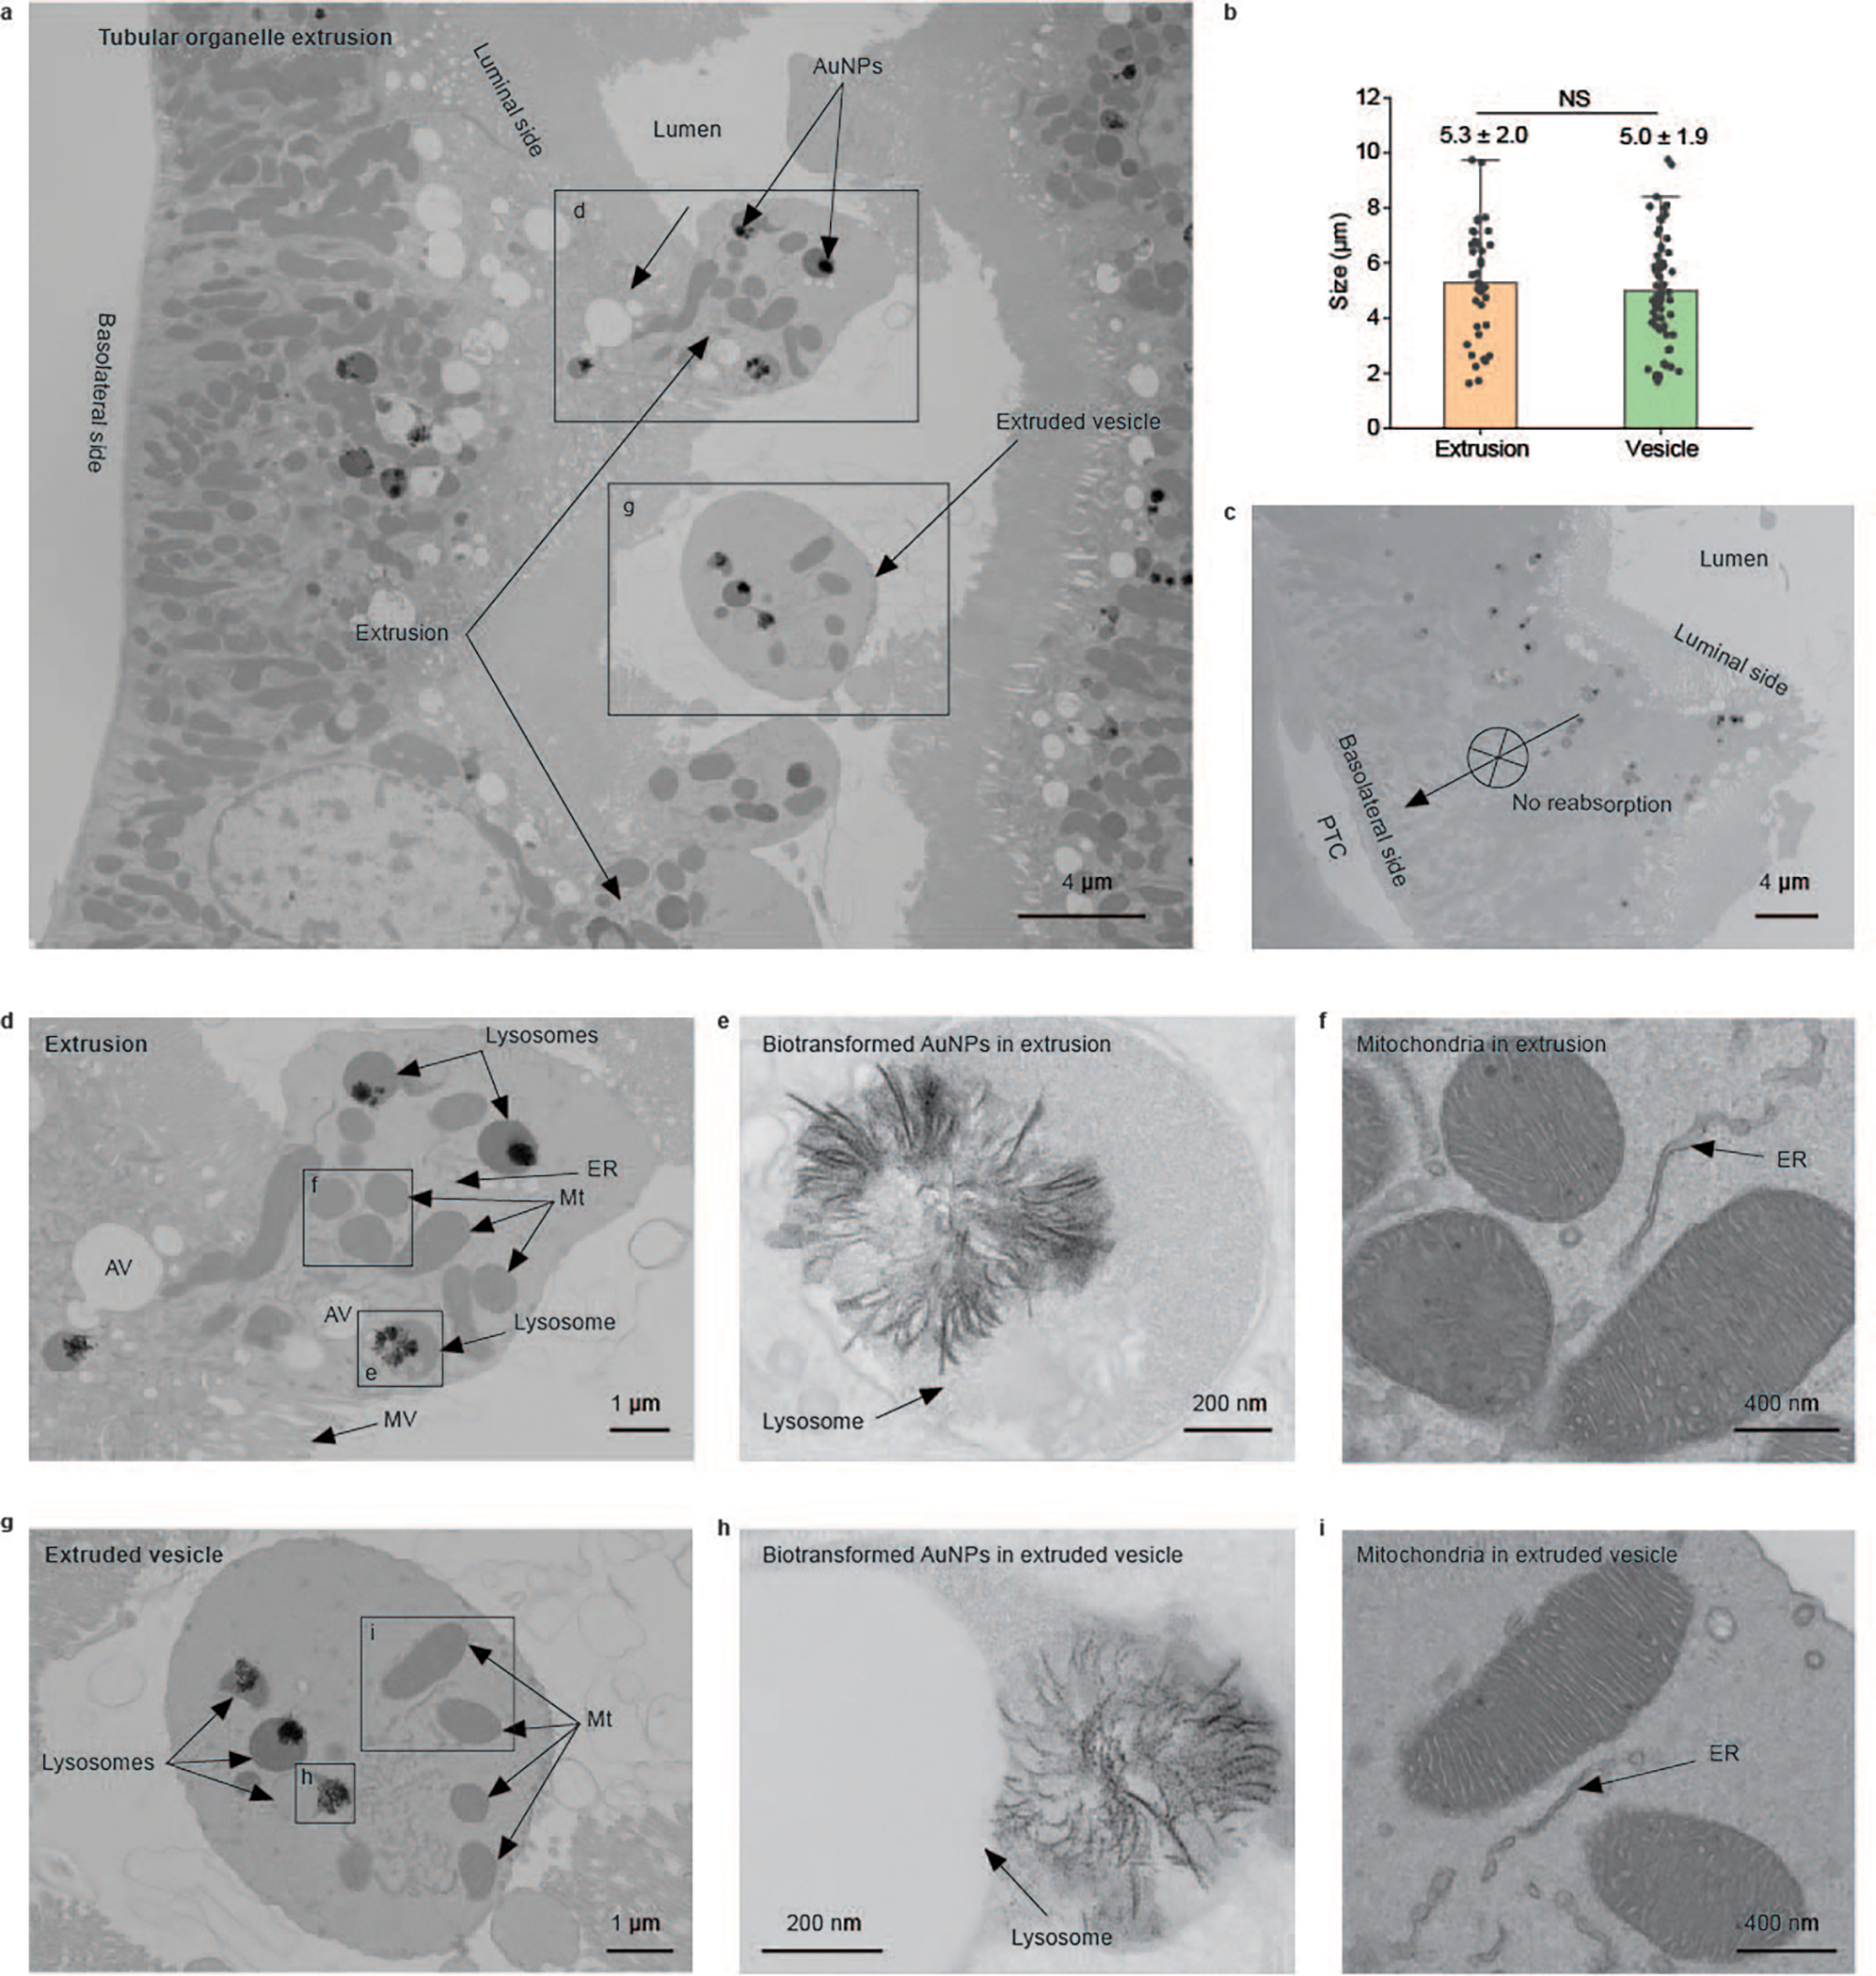
a, A representative EM image of PTs at 24 h p.i. of (+)-AuNPs showing the tubular organelle-extrusion process: a balloon-like fraction of cytoplasm was squeezed through the microvilli and extruded into the extracellular lumen space (labelled as extrusions) to form the extracellular vesicles in the lumen (labelled as extruded vesicles). AuNPs are labelled with arrows. The labelled boxes indicate areas shown in a zoomed-in view in other panels. b, No significant difference (NS) is seen in the sizes of extrusions on the luminal membrane (N = 38, mean ± s.d.) and extruded vesicles in the tubular lumen (N = 67, mean ± s.d.). P = 0.47. Two-sided Student’s t-test was performed at the 0.05 significance level. c, A representative EM image of PTs showing no sign of extrusion on the basolateral side of the PTs and no sign of endocytosed AuNPs on the luminal side migrating to the basolateral side of the PTs and being reabsorbed into the peritubular capillary. d, Magnified EM image of an extrusion in a. The extrusion is devoid of microvilli but contains intracellular organelles including mitochondria (Mt), lysosomes (with or without AuNPs), apical vacuoles (AV) and smooth ER. e, Magnified EM image of a lysosome encapsulating biotransformed AuNPs in the extrusion in d. f, Magnified EM image of mitochondria and ER in the membrane extrusion in d. g, Magnified EM image of an extruded vesicle in a proximal tubular lumen in a. Like the extrusion on the luminal membrane, the extruded vesicle also contained similar organelles such as mitochondria, lysosomes and smooth ER. h, Magnified EM image of lysosome-encapsulated biotransformed AuNPs in the extruded vesicle in g. i, Magnified EM image of mitochondria and ER in the extruded vesicle in g. No gold or silver enhancement staining was used for EM samples. Representative EM images in c, d and g are presented out of images acquired from three independent samples.