
Fig. 5 |. Organelle extrusion is a native physiological function of PTs.
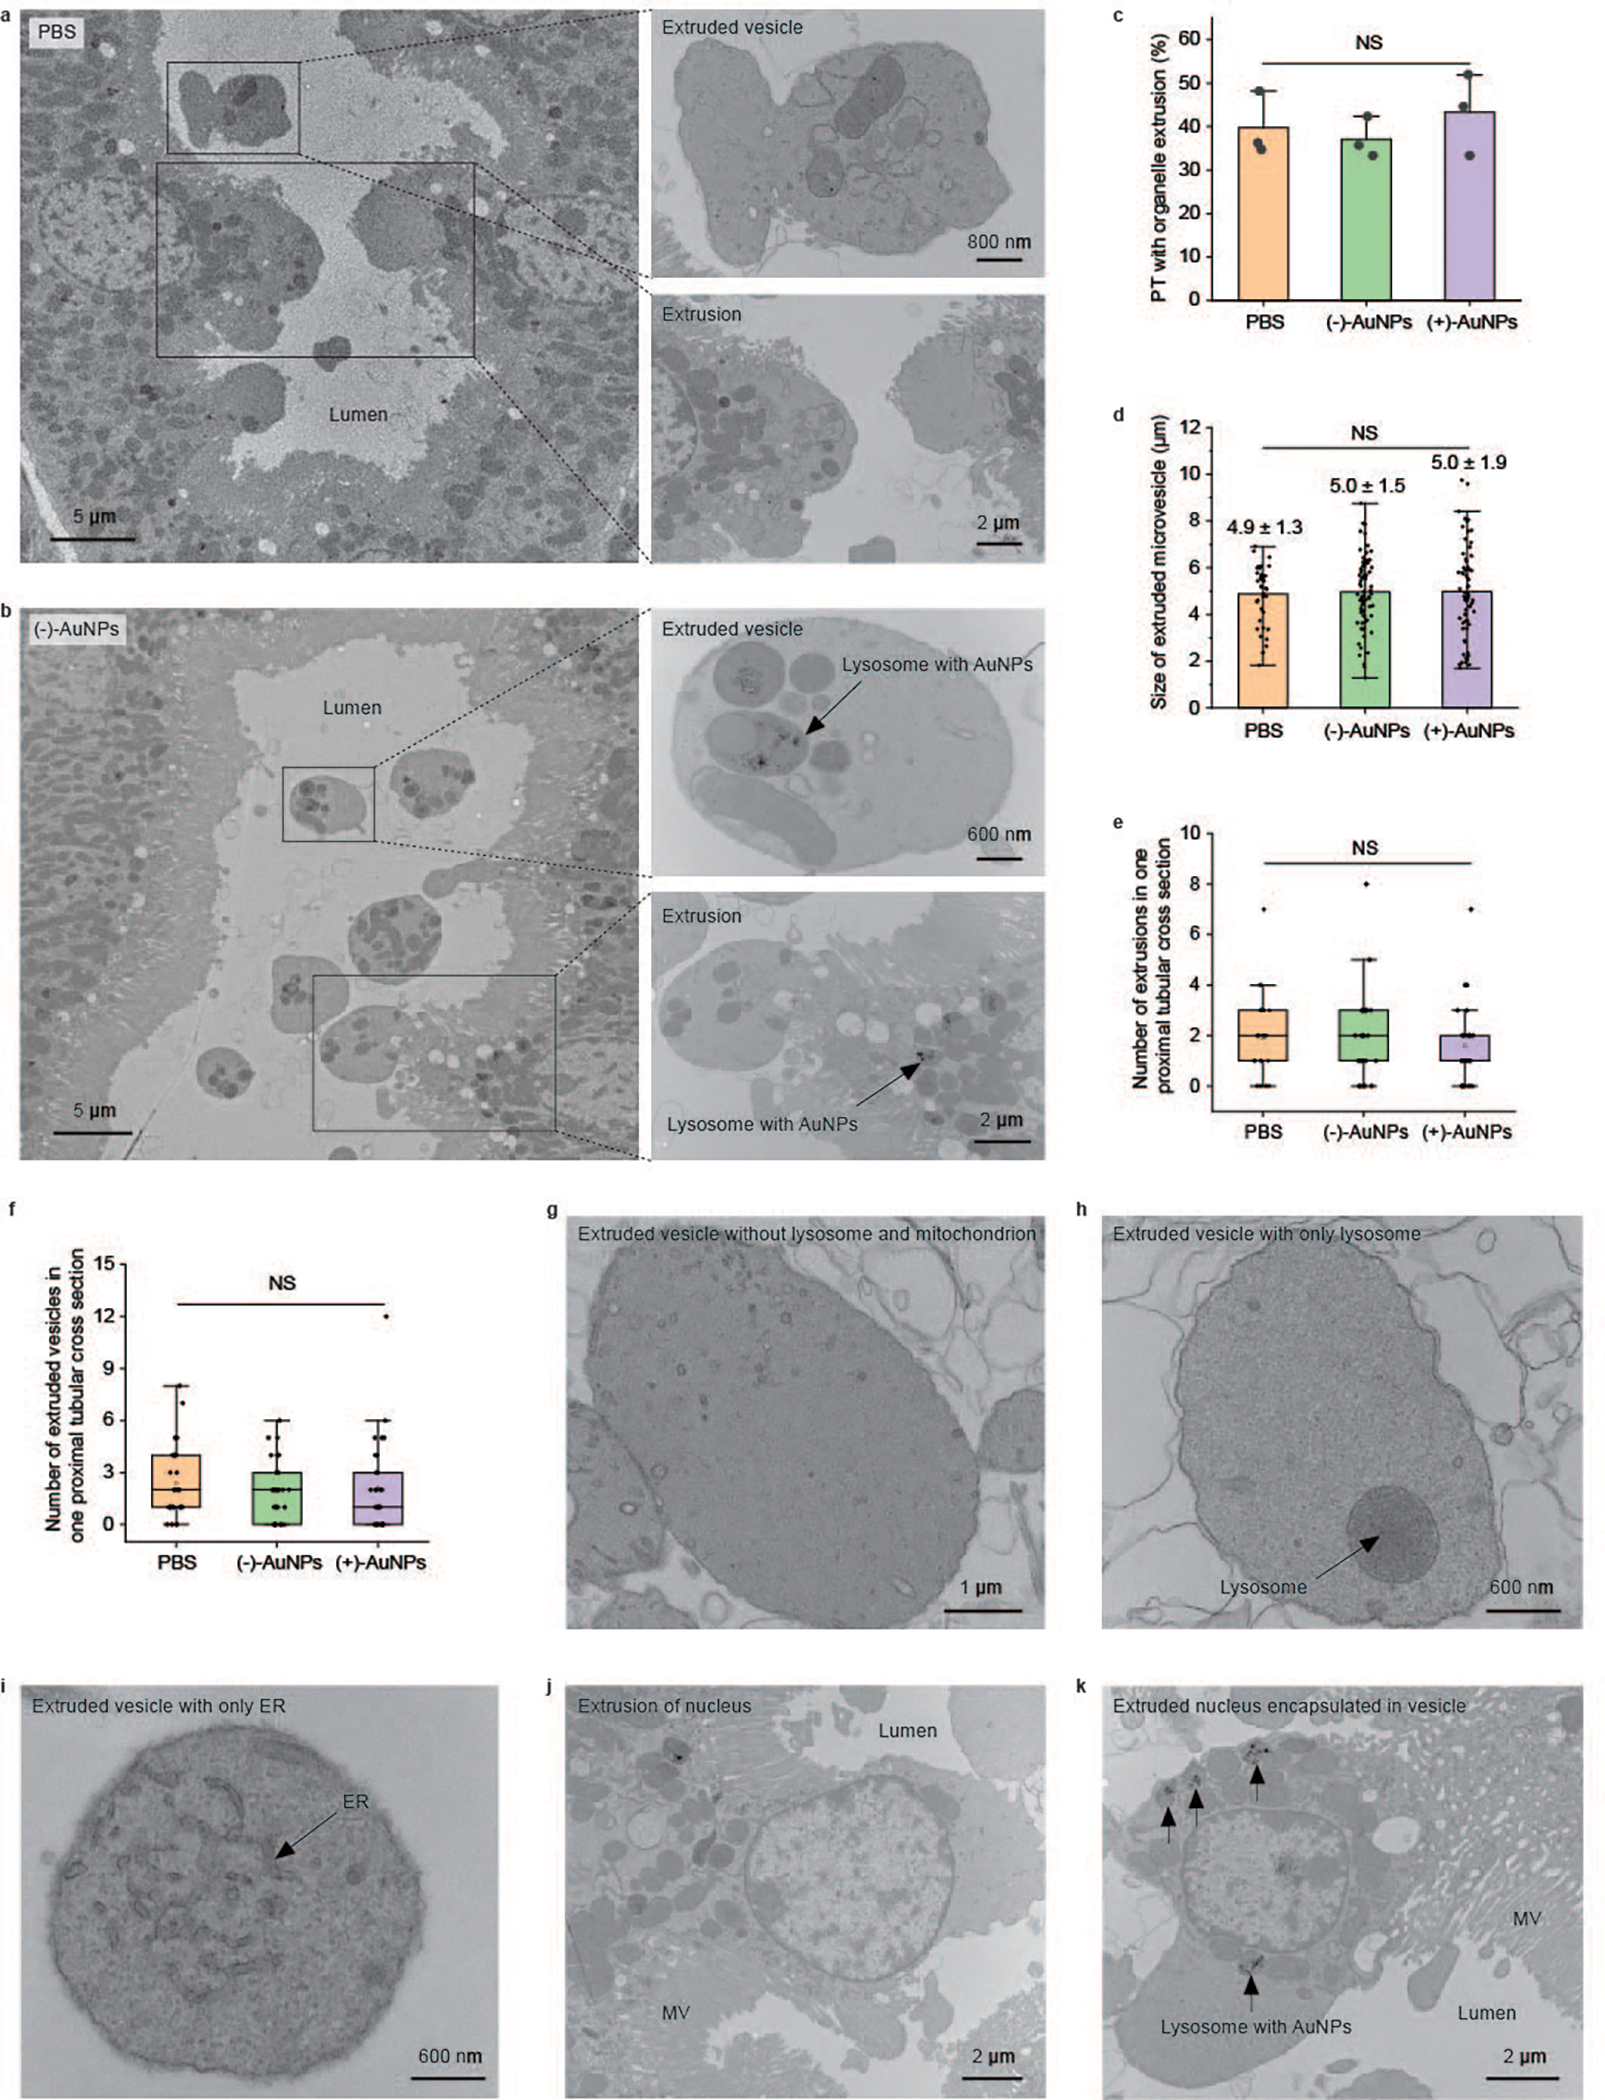
a,b, Representative EM images of tubular organelle extrusions in PBS-injected mice (a) and (−)-AuNP-injected mice (b) at different magnifications. c–f, Quantitative analyses on the percentage of PTs with extrusions (c), sizes of extruded vesicles in the tubular lumen (d), number of extrusions of the proximal tubular cross-section (e) and number of extruded vesicles of the proximal tubular cross-section (f) derived from EM imaging studies of the PTs among mice treated with PBS, (−)-AuNPs and (+)-AuNPs. In c, N = 3 tissue sections of three individual tissue blocks for each group, and more than 70 proximal tubular cross-sections were analysed for each tissue block. P = 0.61. In d, for PBS, (−)-AuNP and (+)-AuNP injection, respectively, N = 38, 74 and 67 extruded vesicles found in three tissue sections from three individual tissue blocks. P = 0.95. In e and f, N = 29 proximal tubular cross-sections analysed in each group. P = 0.64 in e. P = 0.74 in f. Data are presented as mean ± s.d. in c and d. Data are analysed using one-way analysis of variance at the 0.05 significance level in c–f. The boxes in e and f range from the 25th percentile (the first quartile, top of the boxes) to the 75th percentile (the third quartile, bottom of the boxes). The lines in the boxes present the median values. The whiskers are the lowest and highest points within 1.5 times the interquartile range of the lower and higher quartiles. g, A representative EM image of an extruded vesicle containing neither lysosomes nor mitochondria. h, A representative EM image of an extruded vesicle containing only lysosome. i, A representative EM image of an extruded vesicle containing only ER. j, A representative EM image of an extrusion containing a nucleus in PBS-injected mice. k, A representative EM image of an extruded vesicle containing a nucleus and lysosome-encapsulated AuNPs and their nanoassemblies (indicated by arrows) in (−)-AuNP-injected mice. Representative EM images in g–k are presented out of images acquired from three independent samples.