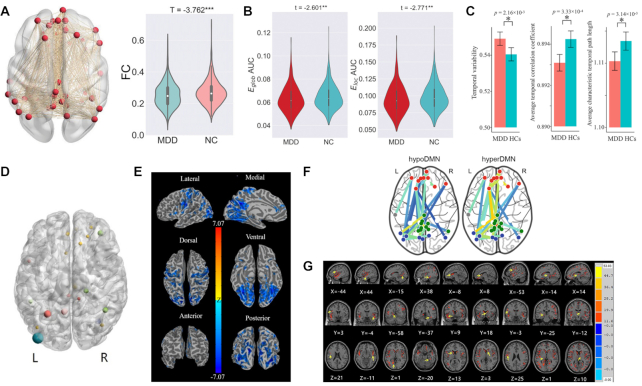
Figure 1:
Principal findings from DIRECT studies. (A) Reduced FC within the DMN is revealed in patients with MDD compared to HCs (Yan et al., 2019). (B) Both decreased global efficiency (Eglob) and local efficiency (Eloc) are found in MDD vs. HC contrast (Yang et al., 2021). (C) Alterations in terms of temporal dynamic properties (increased variability, decreased temporal correlation coefficient, and characteristic temporal path length) are observed in patients with MDD as compared to HCs (Long et al., 2020). (D) Altered PAS scores are primarily observed in DMN (red), VN (blue), FPCN (yellow), and ventral and dorsal attention network (green) in MDD vs. HC contrast (Ding et al., 2021). (E) Reduced VMHC was found in DMN, VN, and SMN regions in MDD vs. HC contrast (Deng et al., 2021). (F) Patients with MDD can be clustered into two subgroups according to FCs within DMN (Liang et al., 2020). (G) Temporal and occipital regions, thalamus, prefrontal, and postfrontal gyrus show difference in GMV among GI, non-GI MDD patients, and HCs (Liu et al., 2021). Abbreviations: PAS, parameter of asymmetry; GI, gastrointestinal; MDD, major depressive disorder; HC, healthy control; DMN, default mode network; VN, visual network; FPCN, fronto-parietal control network; SMN, somato-motor network; FC, functional connectivity; VMHC, voxel-mirrored homotopic connectivity.

