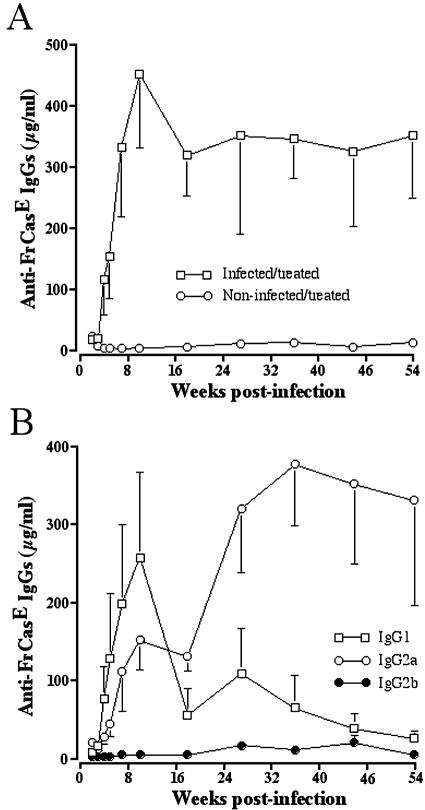
FIG. 2.
Endogenous anti-FrCasE immunoglobulin response in infected/treated mice. Experiments were performed using litters of 9 to 10 animals. (A) Total anti-FrCasE IgG. Blood samples were collected from the infected/treated and noninfected/treated mice presented in Fig. 1A. Total anti-FrCasE IgGs were assayed by ELISA. (B) Anti-FrCasE IgG isotypes. Anti-FrCasE IgG2a, IgG2b, and IgG1 isotypes were assayed in the same serum samples of infected/treated animals as in A. Values are the results of 3 experiments, each one performed in triplicate. Values are presented as the mean ± standard error of the mean. Each point is the average of the different individuals within each experimental group. The errors are calculated from individual variations within each one of these groups.

