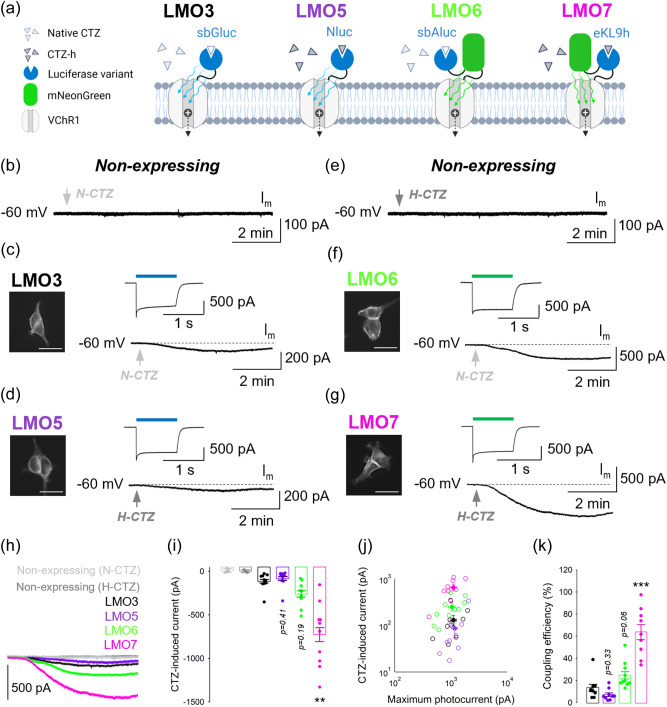
Fig. 2.
Evaluation of the coupling efficiency of new LMOs in HEK cells. (a) Schematic of the four LMOs, with respective CTZ substrates, tested for coupling efficiency. (b) Effect of N-CTZ on membrane current (Im) in a non-expressing HEK cell. (c) Left, EYFP fluorescence imaged in a stable HEK line expressing LMO3. Right, photocurrent response evoked by 480 nm light (1 s) and example trace showing the representative inward current amplitude recorded 5 min post N-CTZ application. (d) Left, EYFP fluorescence imaged in a stable HEK line expressing LMO5. Right, photocurrent response evoked by 480 nm light (1 s) and example trace showing the representative inward current amplitude recorded 5 min post H-CTZ application. (e) Effect of H-CTZ on Im in a non-expressing HEK cell. (f) Left, mNeonGreen fluorescence imaged in a stable HEK line expressing LMO6. Right, photocurrent response evoked by 540 nm light (1 s) and example trace showing the representative inward current amplitude recorded 5 min post N-CTZ application. (g) Left, mNeonGreen fluorescence imaged in a stable HEK line expressing LMO7. Right, photocurrent response evoked by 540 nm light (1 s) and example trace showing the representative inward current amplitude recorded 5 min post H-CTZ application. (h) Example trace comparison of CTZ-induced inward current amplitude across stable HEK lines as indicated. (i) Summary bar graph of average CTZ-induced current amplitude generated with each construct. (j) Summary graph showing correlation between CTZ-induced current and maximum photocurrent in all cells. (k) Summary bar graph showing the coupling efficiency (CTZ-induced current amplitude/maximum photocurrent amplitude) achieved with each construct. (c, d, f, g) Scale bars: . Data are presented as mean ± SEM. ** , *** .

