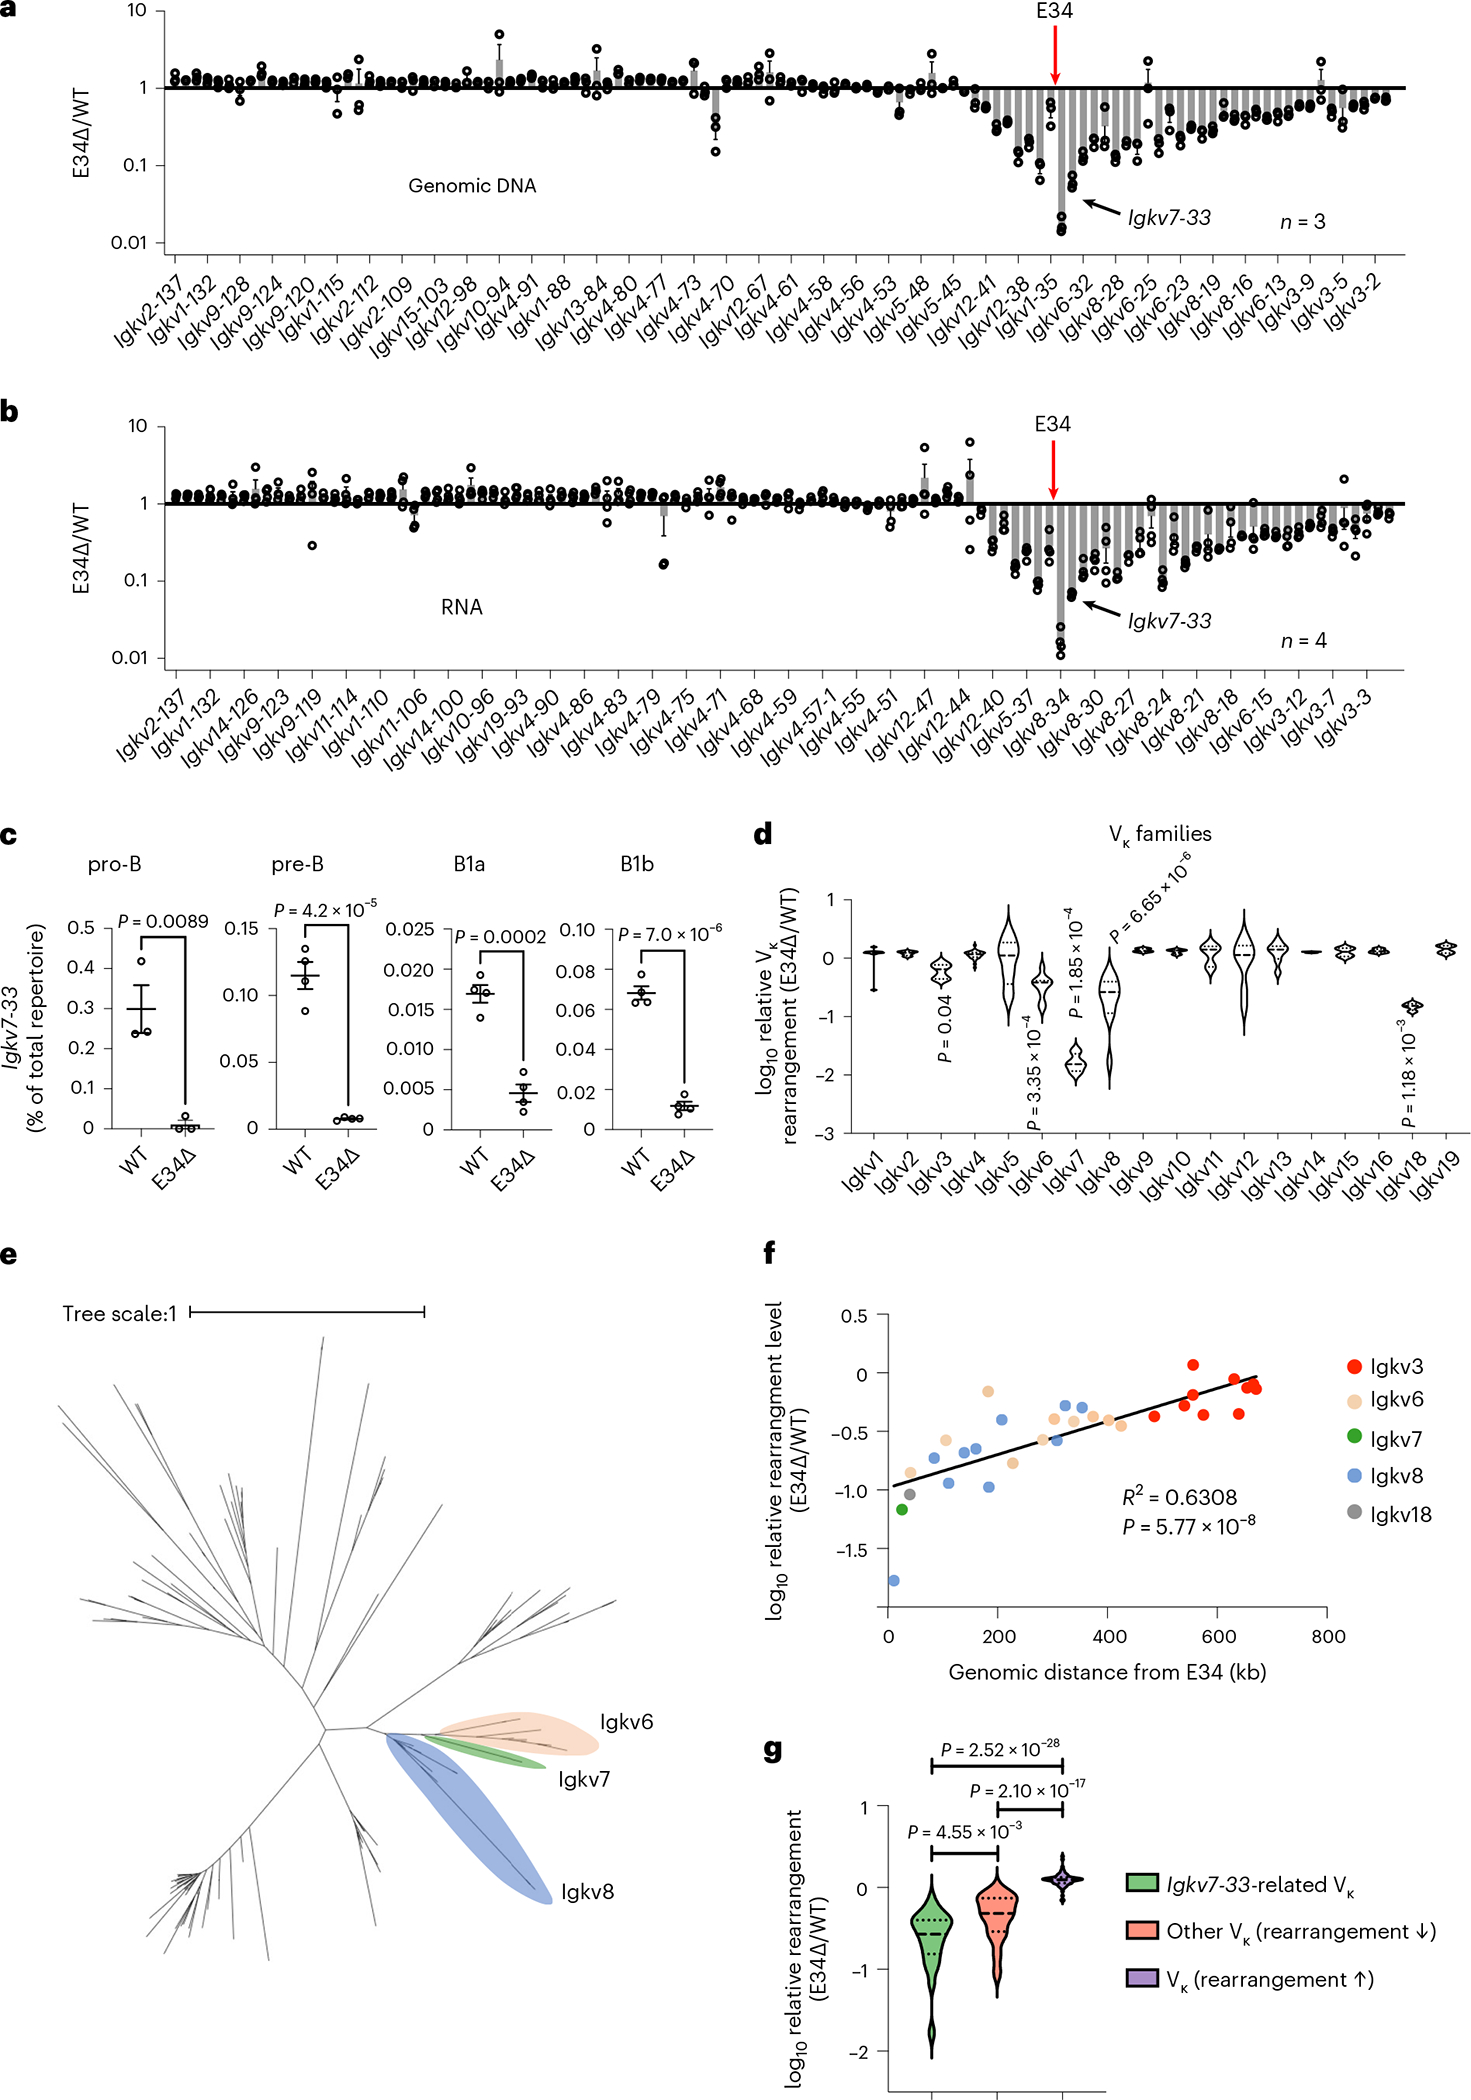
Fig. 1 |. An enhancer that instructs Igkv7–33 gene rearrangement.

a, Relative Vκ gene rearrangement frequencies, using genomic DNA (gDNA) as starting material, in WT and E34Δ adult bone marrow pre-B cells are shown. b, Relative Vκ gene rearrangement frequencies, using RNA as starting material, in WT and E34Δ adult bone marrow pre-B cells are shown. RNA and gDNA were derived from WT and E34Δ adult bone marrow pre-B cells and analyzed for Vκ gene usage. Data were derived from three (gDNA) and four (RNA) independent experiments using one mouse for each genotype per experiment and are expressed as the ratio of gene usage in E34Δ versus WT pre-B cells ± s.e.m. c, Levels of Igkv7–33 rearrangements in pro-B, pre-B, B1a and B1b B cells derived from E34Δ or littermate (WT) mice. Data were derived from three (pro-B) and four (pre-B, B1a and B1b) independent experiments and are expressed as a percentage of the total number of reads ± s.e.m. Significant differences between groups were assessed using an unpaired t-test. d, Violin plots show relative rearrangement frequencies in E34Δ and littermate (WT) pre-B cells for indicated Vκ gene families. Dashes and dotted lines represent means and quartiles, respectively. Significant differences between each group with reduced rearrangement and the combined data from all groups were assessed using an unpaired t-test. e, Phylogenetic analysis of functional Vκ genes. Indicated are families most affected by the E34 deletion with the exception of the Igkv18 family. The distance scale represents the percentage of genetic variation between the sequences. f, Correlation between the genomic distance and relative levels of rearrangement among the Vκ gene families that showed significantly reduced rearrangement frequencies. Correlation coefficient (r) and P values were calculated using simple linear regression. g, Violin plots showing the relative frequencies of rearrangements between genetically Igkv7–33-related Vκ genes (green), non-Igkv7–33-related Vκ genes associated with reduced rearrangement frequencies (orange) and Vκ genes linked with increased rearrangement frequencies (purple). Significant differences between groups were assessed using an unpaired t-test. Dashes and dotted lines represent means and quartiles, respectively. Rearrangement frequencies for a, b and f are shown as averages of the ratio of E34Δ versus littermate controls (WT).
