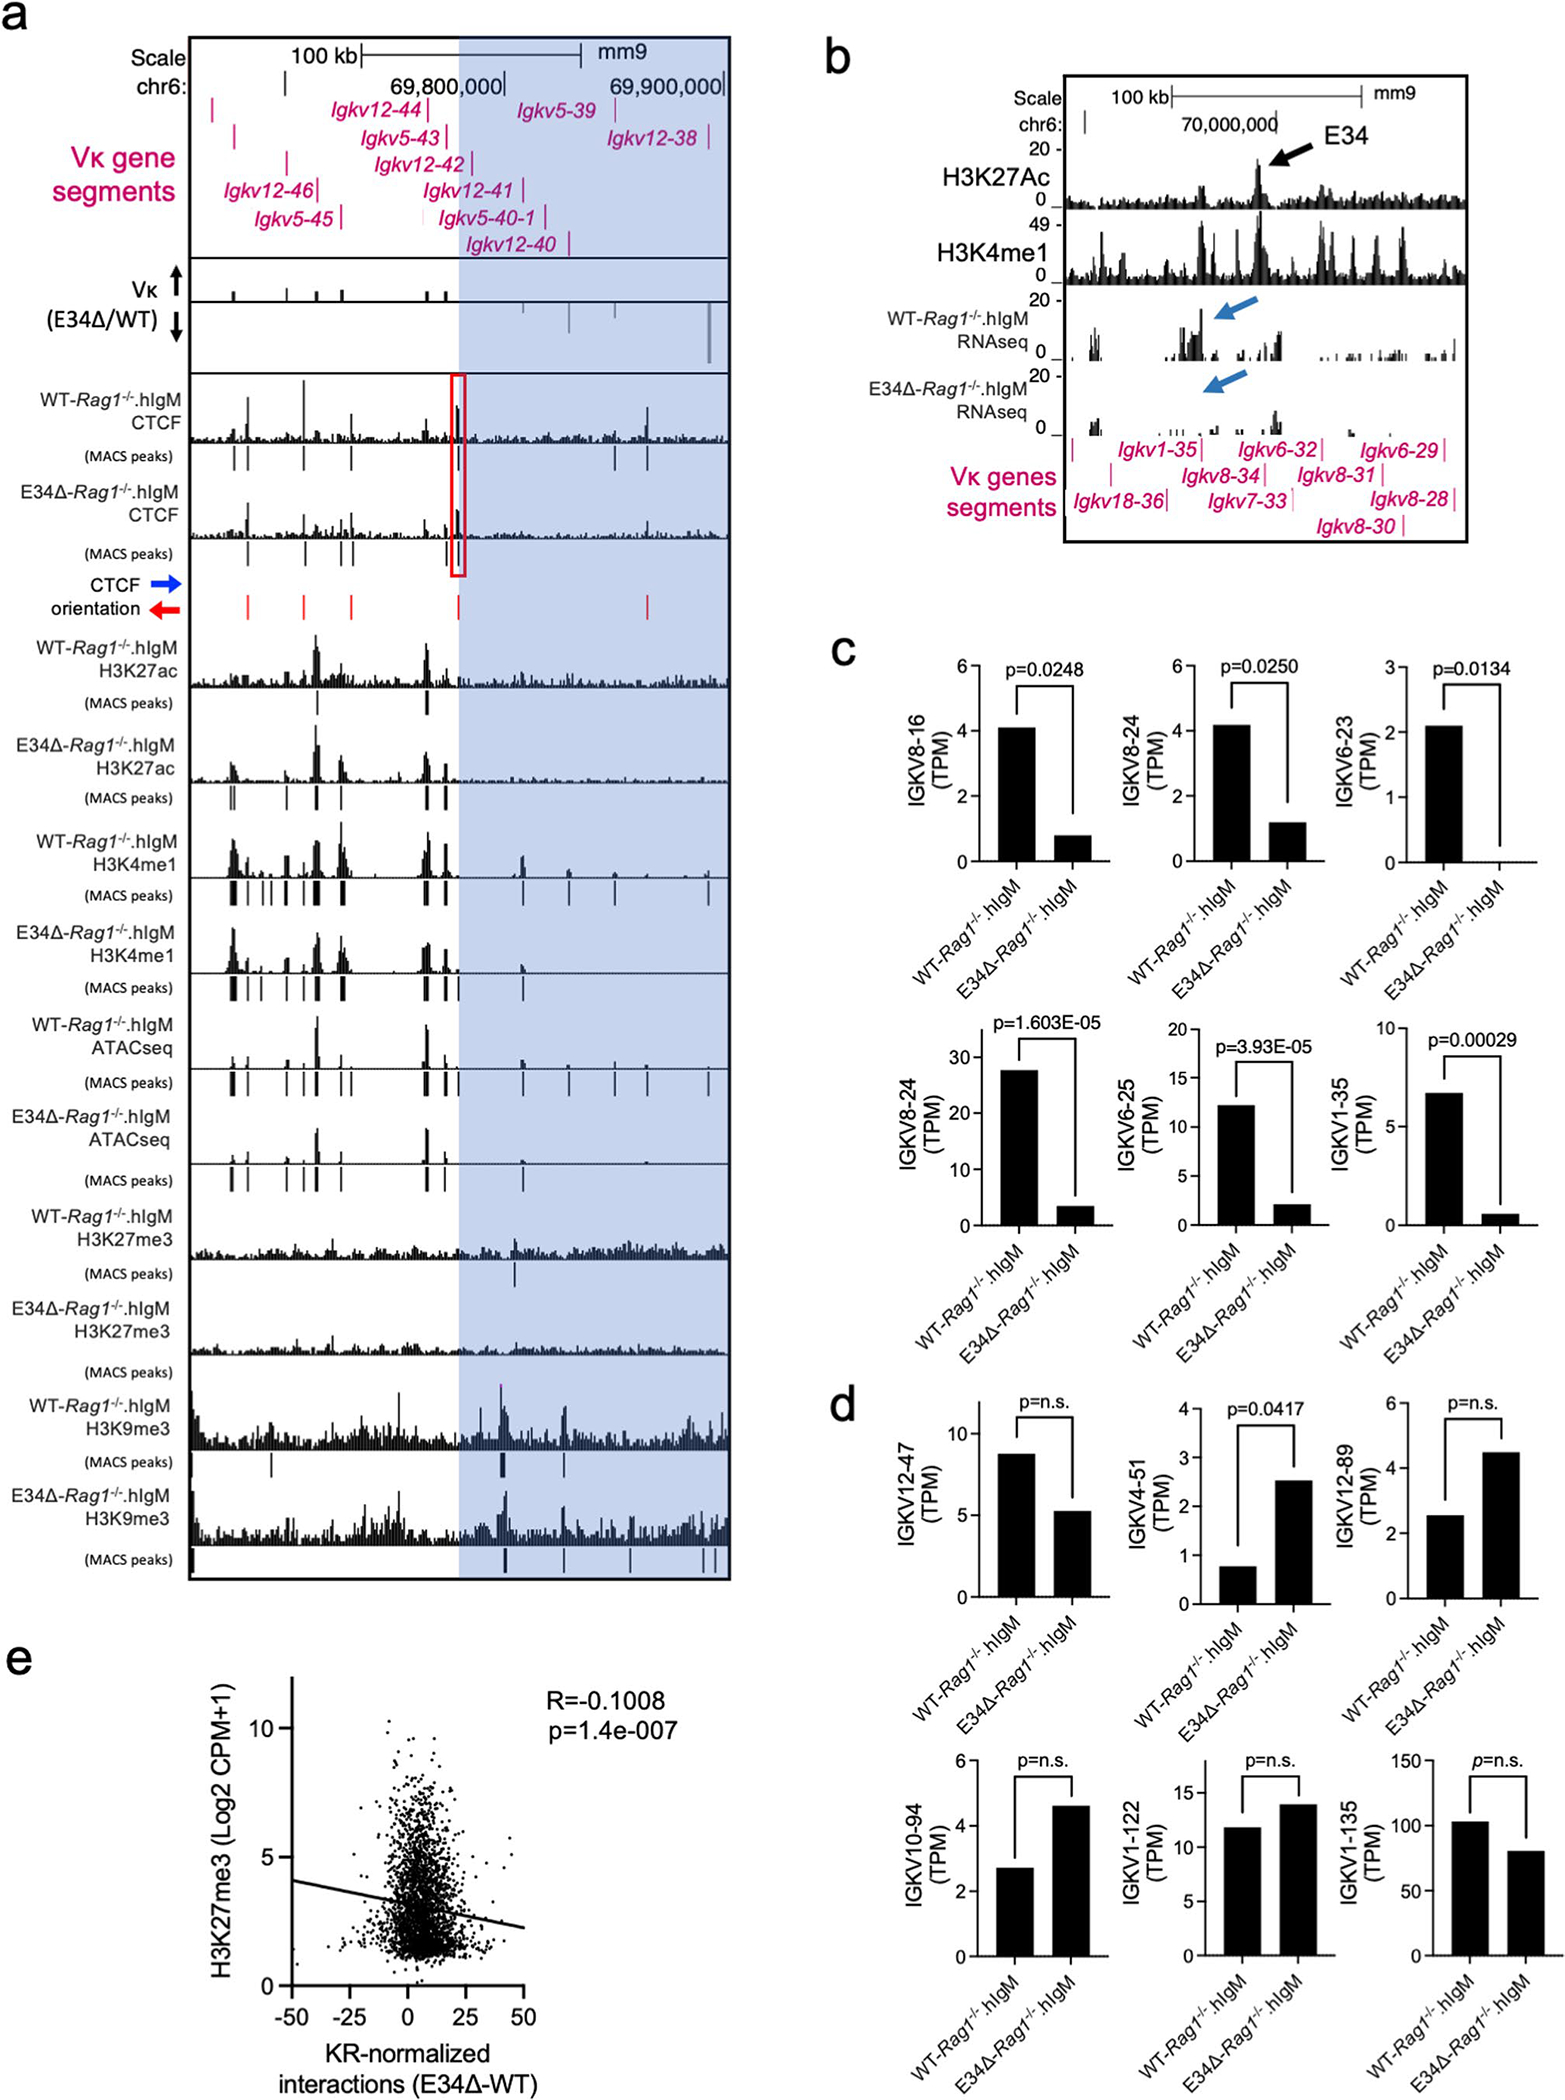
Extended Data Fig. 6 |. Igk locus non-coding transcription and epigenetic profiling at the 5′ boundary of the E34 subTAD in WT-Rag1−/−.hIgM and E34Δ-Rag1−/−.hIgM pre-B cells.

a, UCSC genome browser tracks spanning the Igk locus showing the deposition of CTCF, H3K27ac, H3K4me1, H3K27me3, and H3K9me3, as well as ATAC-seq reads in WT-Rag1−/−.hIgM and E34Δ-Rag1−/−.hIgM pre-B cells. Vκ rearrangement is also shown (E34Δ/WT). Significant peaks were called using MACS2 (Cutoff FDR < 0.05). The p-values cutoff for H3K9me3 reads was 0.001. Blue highlight indicates a genomic region downstream of the CTCF binding site affected by the E34 deletion. b, Genome browser view of the Igk locus centered on the E34 enhancer shows RNA-seq reads in WT-Rag1−/−.hIgM and E34Δ-Rag1−/−. hIgM pre-B cells. Blue arrows indicate affected transcripts. Tracks showing the deposition of H3K27Ac (GSM3103098) and H3K4me1 (GSM2084579) are shown. c, Non-coding transcripts expressed within the E34 subTAD with statistically significant changes are indicated. Data is expressed as Transcripts Per Million (TPM). DEseq analysis was used to calculate statistically significant changes for biological replicates. p-values are indicated. DEseq uses a negative binomial generalized linear model to determine significance of differences between transcript abundance. Data is derived from two independent experiment (two mice per group per genotype). d, Non-coding transcripts expressed in genomic regions located across the Igk locus but away from the E34 subTAD are shown. Data is derived from two independent experiment (two mice per group per genotype). DEseq analysis was used to calculate statistically significant changes in terms of p-values for biological replicates. p-values are indicated. DEseq uses a negative binomial generalized linear model to determine significance of differences between transcript abundance. e, Correlation between enrichment of H3K27me3 and KR-normalized interaction frequencies (E34Δ-WT) involving the E34 subTAD when compared to other genomic regions spanning chromosome 6 are indicated. Correlation coefficient (r) and p-values were calculated using simple linear regression.
