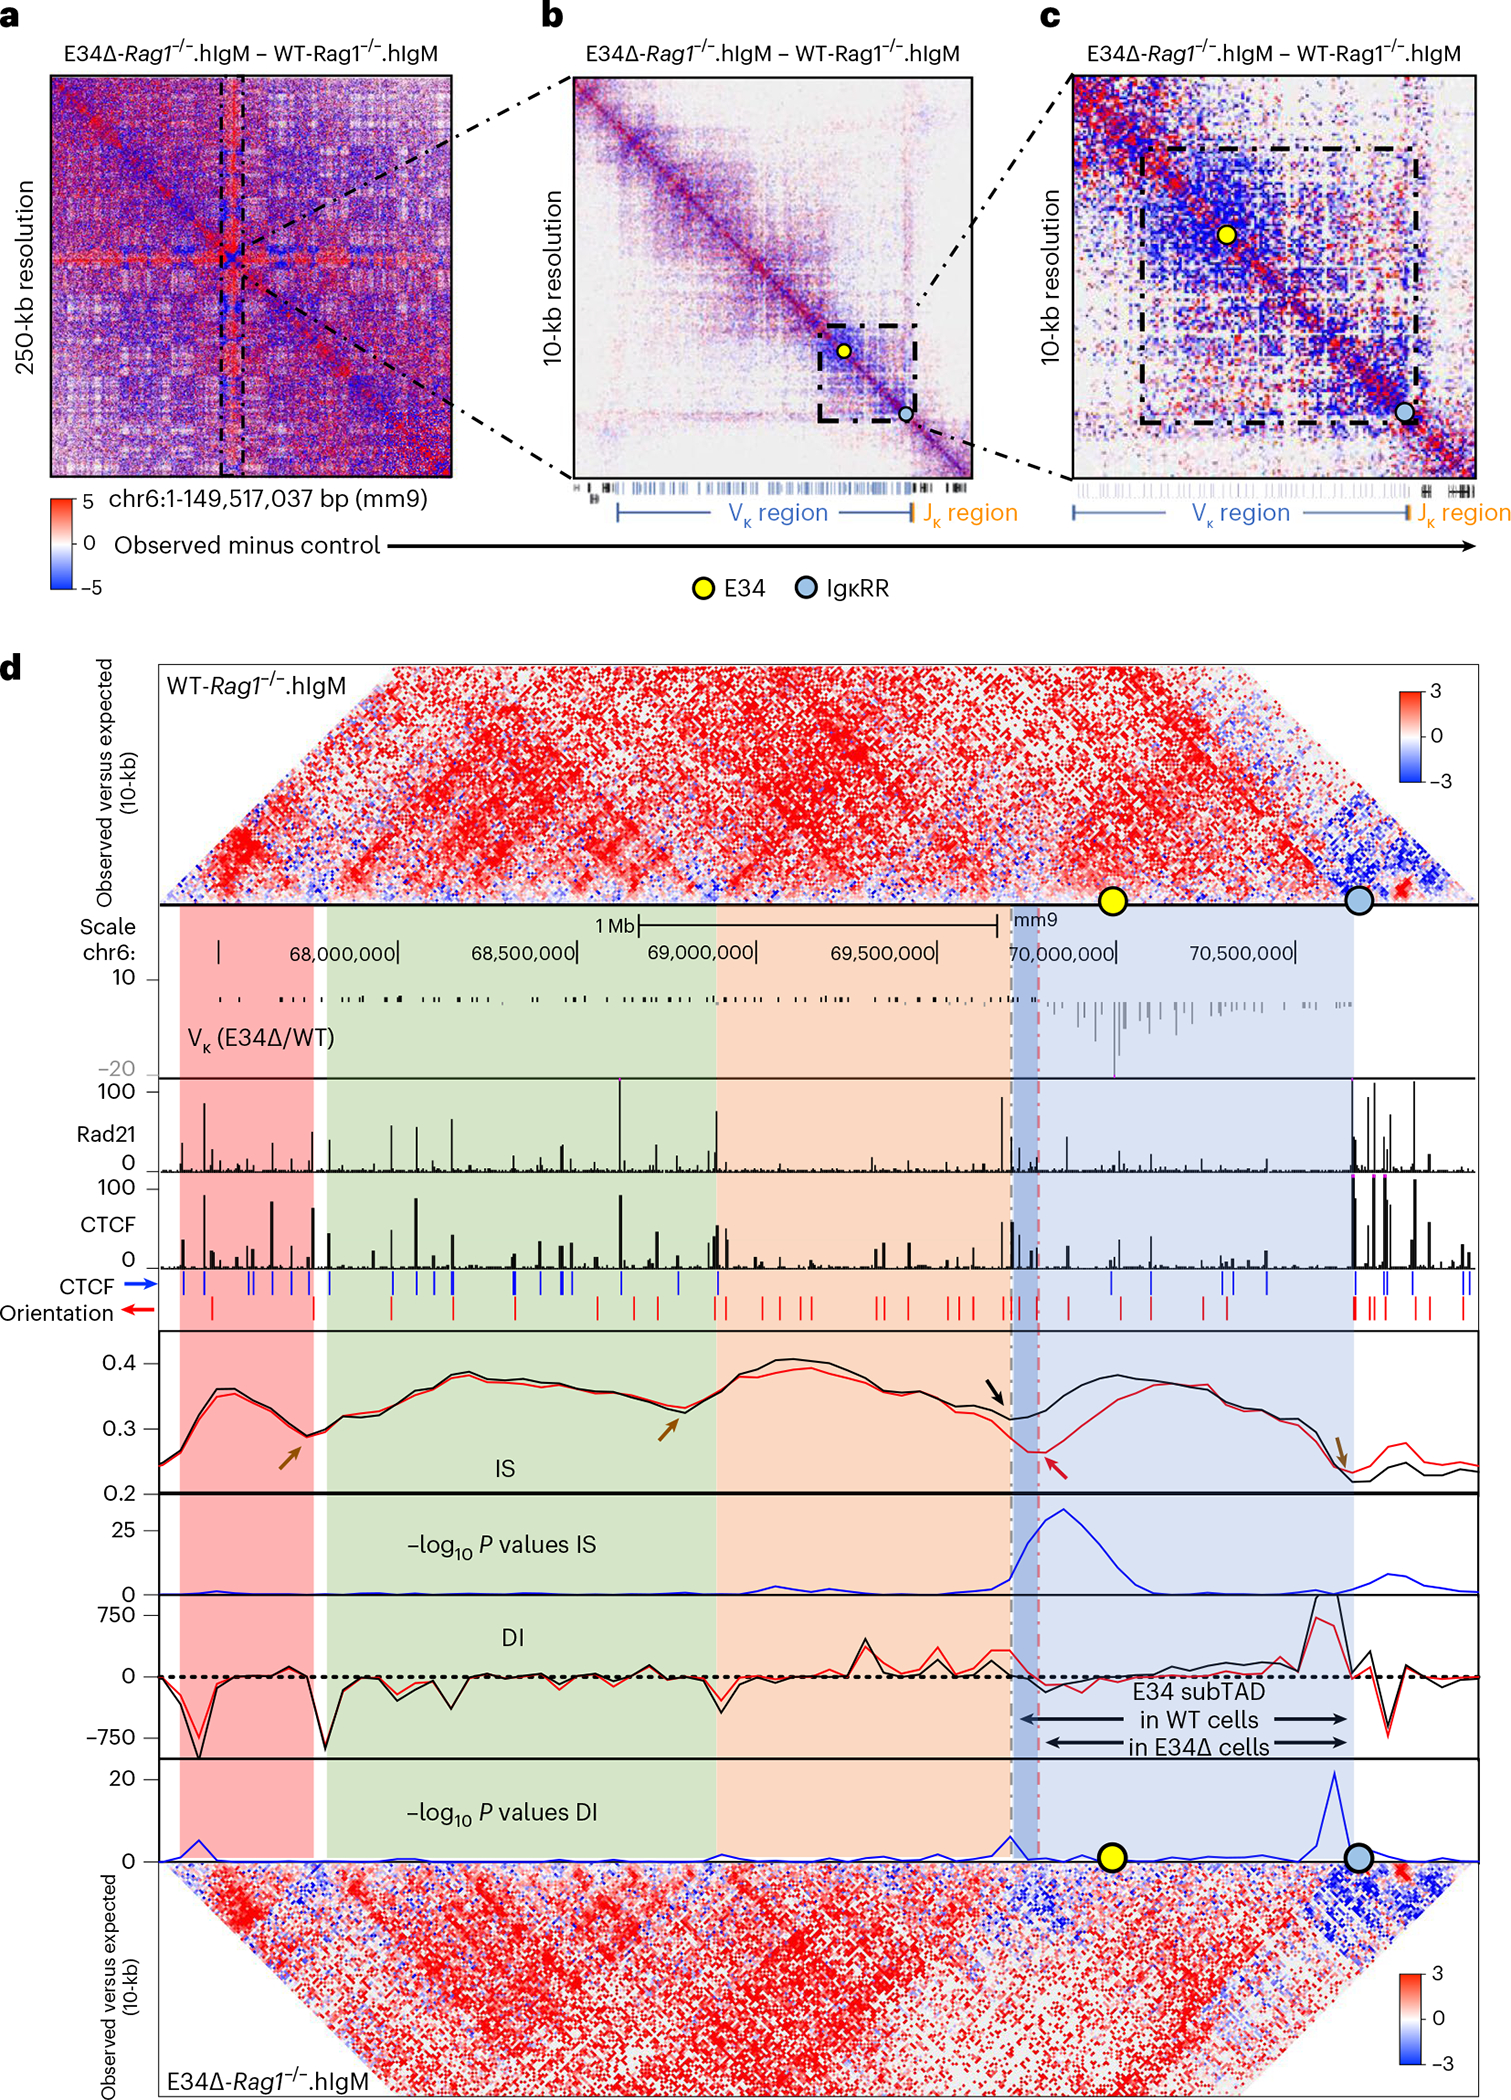
Fig. 2 |. The E34 enhancer instructs changes in chromatin folding and boundary elements.

a–c, HiC matrix differential contact heatmaps showing chromatin interaction frequencies in WT-Rag1−/−.hIgM and E34Δ-Rag1−/−. hIgM pre-B cells for: chromosome 6 (a), the Igk locus (b) and a genomic region spanning the E34 enhancer (c). Indicated are the locations of the E34 enhancer (yellow dot) and the IgκRR (blue dot). Data are derived from two independent experiments using four mice each in experiment 1 and two mice each for experiment 2. d, HiC contact matrices for WT-Rag1−/−.hIgM (top) and E34Δ-Rag1−/−.hIgM (bottom) pre-B cells. Heatmaps indicate normalized interaction frequencies. Indicated are the locations of the E34 enhancer (yellow dot) and the IgκRR (blue dot). Black lines indicate IS and DI scores associated with the genomes derived from WT-Rag1−/−.hIgM pre-B cells. Red lines indicate IS and DI scores associated with the genomes derived from E34Δ-Rag1−/−.hIgM pre-B cells. Shown are tracks indicating Vκ rearrangement (E34Δ/WT), Rad21 occupancy (GSM2973688), CTCF occupancy (GSM2973687) and CTCF binding orientation (blue and red arrows). Shown are IS and the DI. Brown arrows indicate unaltered DI scores or potential boundaries segregating subTADs for WT-Rag1−/−.hIgM versus E34Δ-Rag1−/−.hIgM pre-B cells. Black and red arrows indicate a boundary element segregating two subTADs in WT-Rag1−/−.hIgM and E34Δ-Rag1−/−.hIgM pre-B cells, respectively. SubTADs were identified using DI and IS as well as CTCF-marked boundary elements. SubTADs are highlighted by color. The genomic region spanning the E34 subTAD in WT-Rag1−/−.hIgM pre-B cells is highlighted in light and dark blue. Light-blue highlight indicates the E34 subTAD in E34Δ-Rag1−/−.hIgM pre-B cells. Tracks show −log10 P values for IS and DI scores for WT-Rag1−/−.hIgM versus E34Δ-Rag1−/−.hIgM pre-B cells (blue lines). A two-sided Z-test was used to calculate P values.
