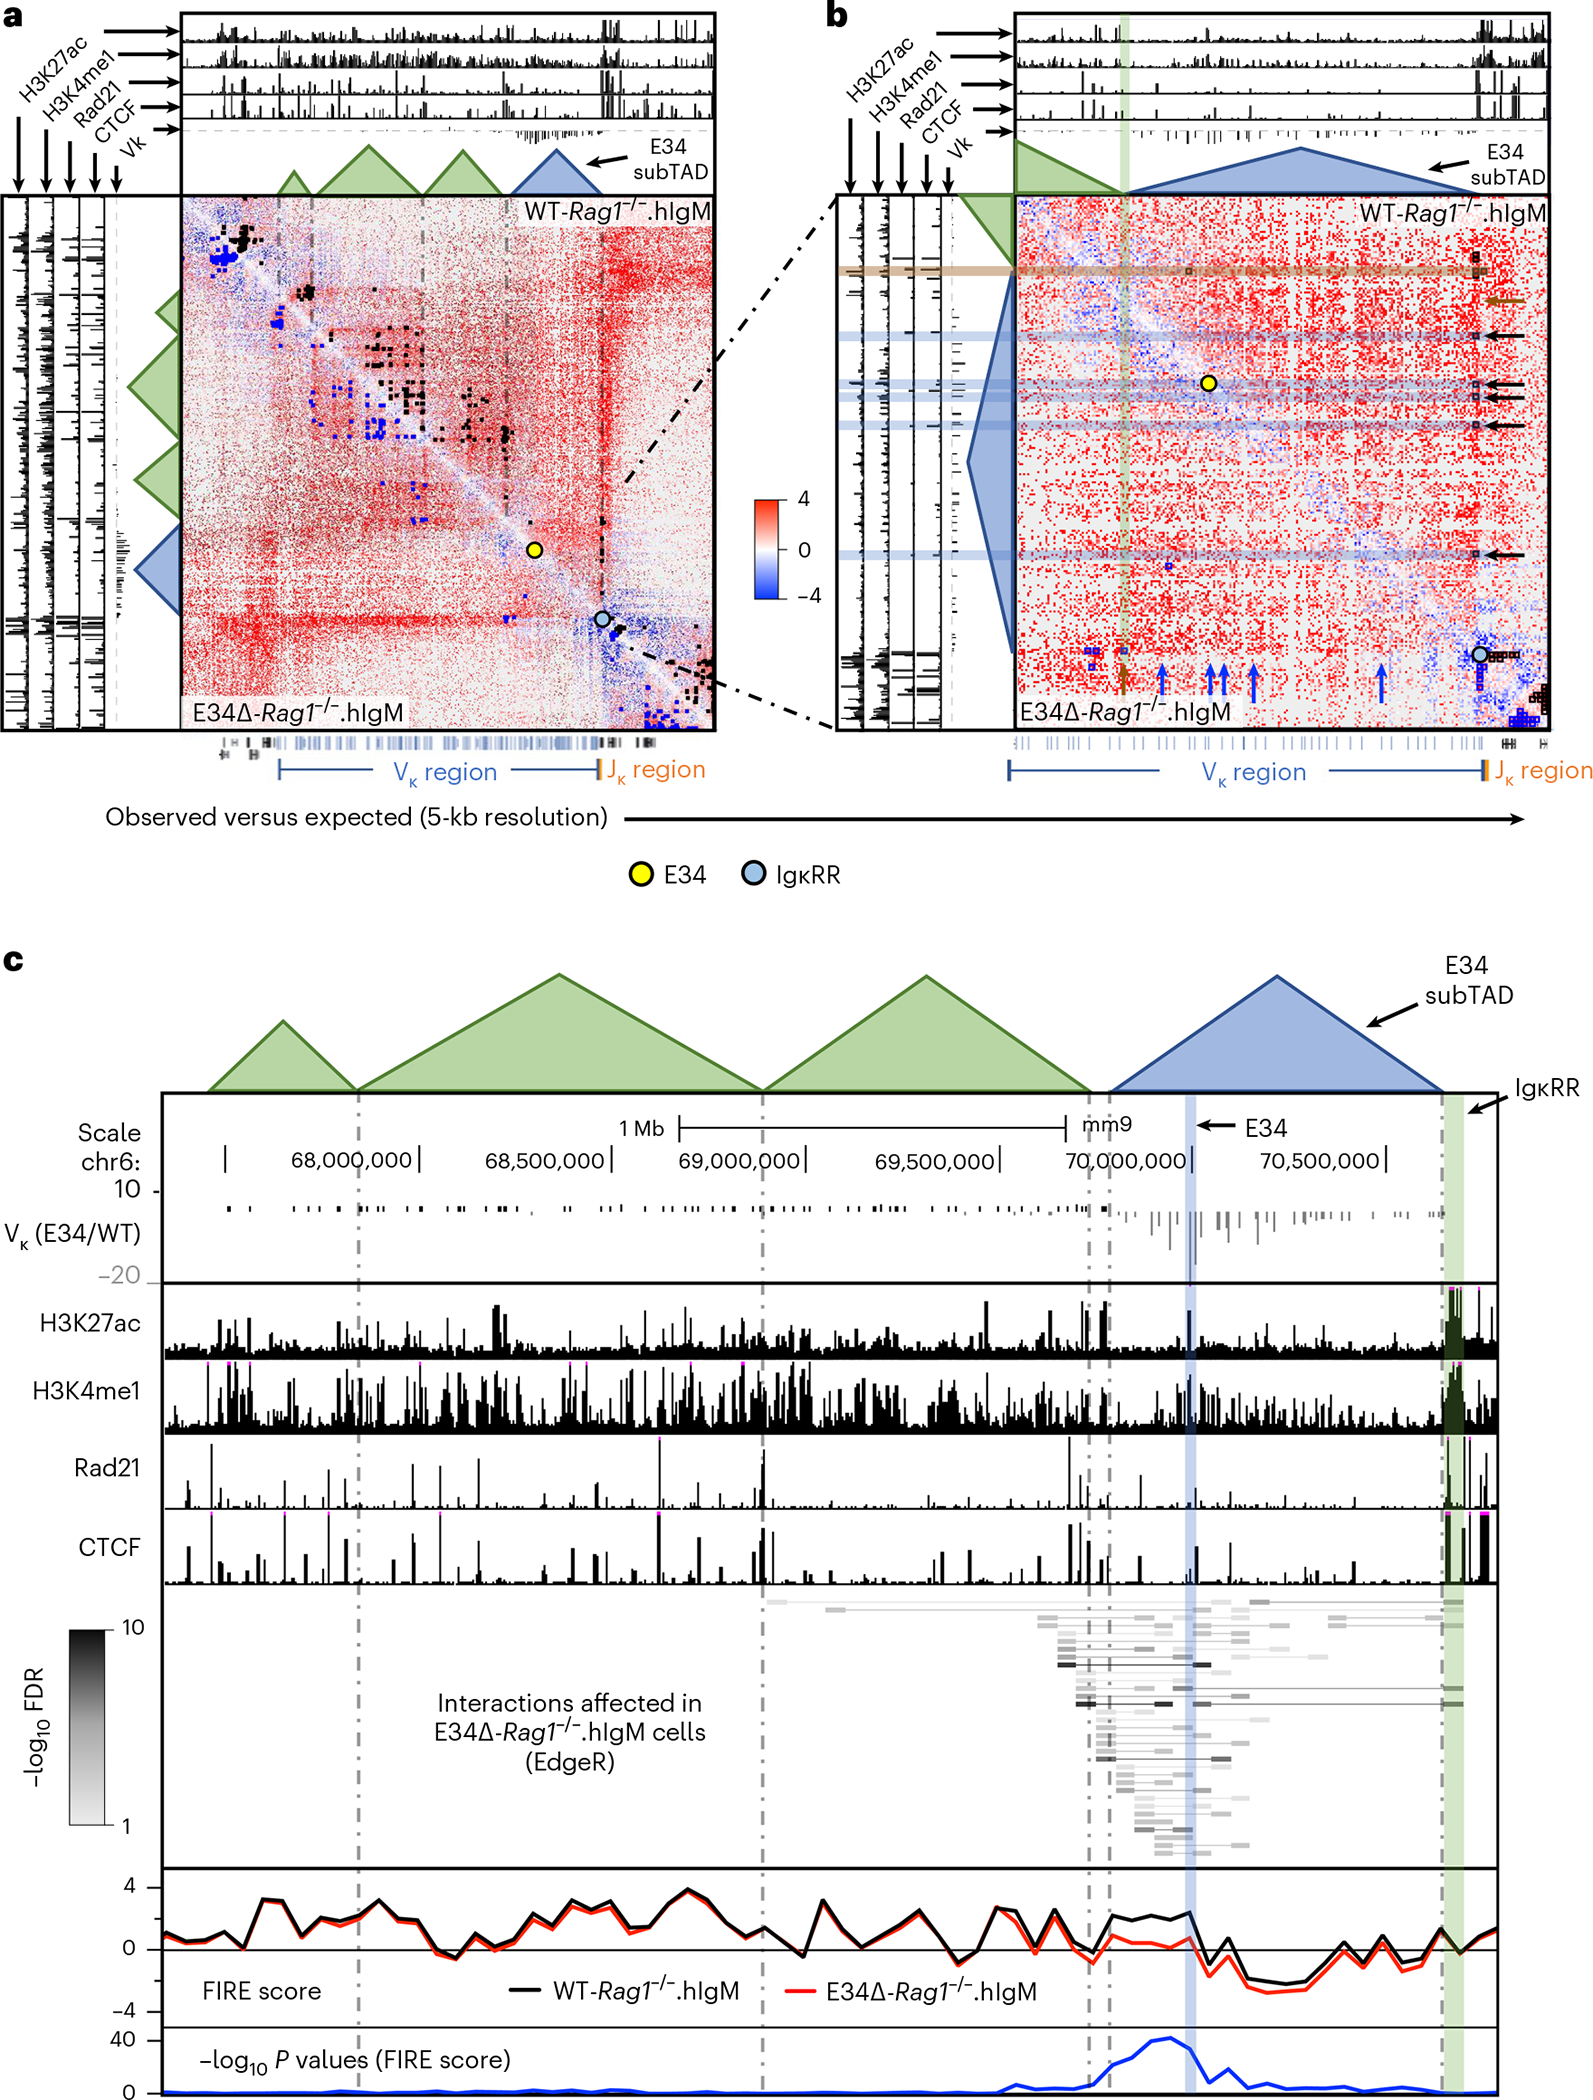
Fig. 3 |. The E34 enhancer instructs the chromatin interaction landscape across the Igk locus.

a, HiC matrix contact heatmaps for a genomic region around the Igk locus in WT-Rag1−/−.hIgM and E34Δ-Rag1−/−.hIgM pre-B cells are shown. b, HiC matrix contact heatmaps for a genomic region located in the vicinity of the E34 enhancer in WT-Rag1−/−.hIgM and E34Δ-Rag1−/−.hIgM pre-B cells are shown. Tracks show the deposition of H3K27ac, H3K4me1, Rad21 and CTCF as well as relative Vκ rearrangement frequencies (E34Δ/WT). Indicated are chromatin interactions detected by FitHiC2 in WT-Rag1−/−.hIgM (black dots) and E34Δ-Rag1−/−.hIgM (blue dots) cells. Bottom shows the location of the Vκ (blue), Jκ (orange) and other gene segments (black). Yellow and blue dots indicate the genomic locations of the E34 enhancer and the IgκRR, respectively. c, Chromatin interactions affected by the E34 deletion across the Igk locus were analyzed using EdgeR (50-kb resolution). The E34 enhancer, the IgκRR and subTADs that span the Igk locus are indicated. Tracks show relative Vκ rearrangement frequencies (E34Δ/WT) and the deposition of H3K27ac, H3K4me1, Rad21 and CTCF. Gray scale represents negative log10 P values for each interaction as revealed using EdgeR. FIRE scores calculated for WT-Rag1−/−.hIgM and E34Δ-Rag1−/−.hIgM pre-B cells are indicated. Significant differences for FIRE scores between WT-Rag1−/−.hIgM and E34Δ-Rag1−/−.hIgM pre-B cells are shown as negative log10 P values and were calculated using a two-sided Z-test. FDR, false discovery rate.
