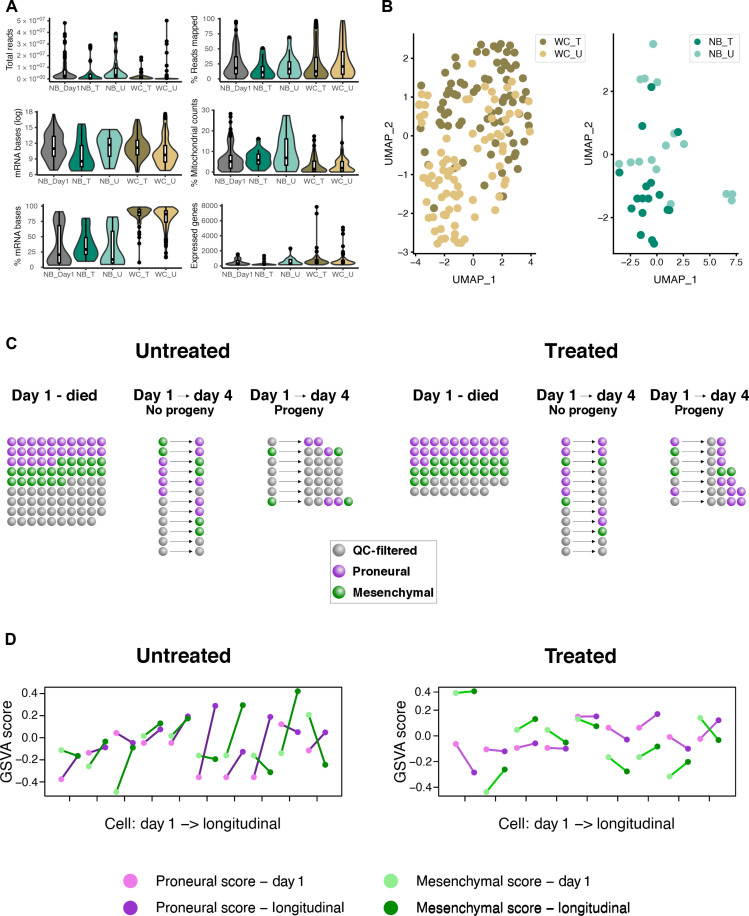
Fig. 4. Gene expression profiling of longitudinal nanobiopsy samples determines the phenotype changes of individual glioblastoma cells through therapy.
(A) Main sequencing metrics of day-1 nanobiopsy (NB_Day1), longitudinal nanobiopsy of treated (NB_T) and untreated (NB_U), and whole-cell lysate treated (WC_T) and untreated (WC_U) samples. (B) Uniform Manifold Approximation and Projection (UMAP) visualization of treated and untreated whole-cell lysate and longitudinal nanobiopsy samples. (C) Nanobiopsy count after quality control (QC) filtering (gray), and gene set variation analysis (GSVA) scoring for the proneural (purple) and mesenchymal (green) phenotypes. (D) Cell scores from GSVA of proneural (purple) and mesenchymal (green) phenotypes for the paired day-1 (light color) and longitudinal (dark color) samples. The crossing of the lines indicates a subtype switch of the cell.

