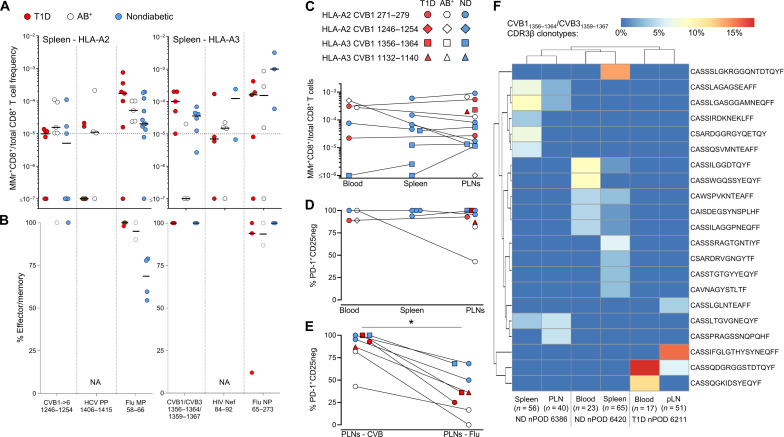
Fig. 4. CVB-reactive CD8+ T cells are also found in spleen and PLNs and display a PD-1+ phenotype.
(A and B) Detection of CVB epitope–reactive CD8+ T cells in splenocytes from nPOD organ donors (HLA-A2+, left; and HLA-A3+, right; see details in table S3). Each symbol represents a donor, and bars indicate median values. (A) depicts the frequency of MMr+CD8+ T cells out of total CD8+ T cells, with the horizontal line indicating the 10−5 frequency cutoff. A median of 73,320 CD8+ T cells were counted (range 9,611 to 307,697). Only epitopes testing positive are depicted (complete peptide panels listed in fig. S5A). (B) displays the percent effector/memory fraction within each MMr+CD8+ population for those donors/epitopes with ≥5 MMr+ cells counted. (C and D) CVB epitope–reactive CD8+ T cells in lymphoid tissues from nPOD cases. CVB MMr+CD8+ T cell frequencies (C) and percent PD-1+CD25− MMr+ cells (D; for donors/epitopes with cell counts of ≥5) across available tissues are depicted. (E) Comparison of PD-1+CD25− fractions between CVB and influenza virus MMr+CD8+ T cells detected in the same PLN; *P = 0.014 by Wilcoxon signed rank test. (F) Expanded TCR CDR3β clonotypes in individual CVB1/CVB31356–1364/1359–1367-reactive CD8+ T cells from the same nPOD cases/tissues. Expanded clonotypes were defined as those found in ≥3 MMr+ cells in the same tissue from the same donor and are clustered according to frequency (one columns per tissue/case) and sequence similarity (one row per CDR3β clonotype). Further details are provided in figs. S5 and S6. ND, nondiabetic.

