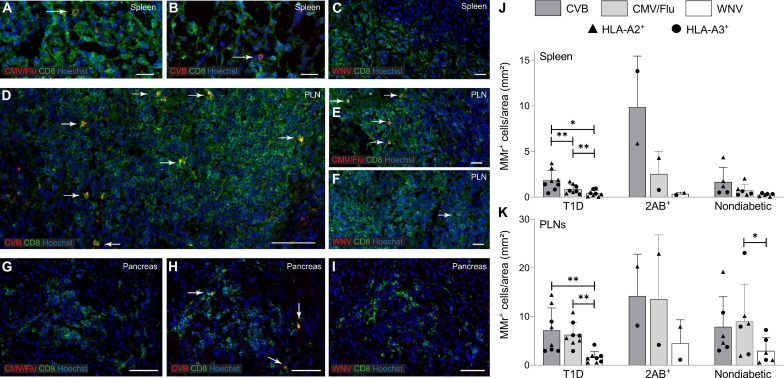
Fig. 5. CVB-reactive CD8+ T cells stained on spleen and PLN tissue sections are more abundant than other viral antigen reactivities in T1D donors.
(A to I) Representative immunofluorescence images of the spleen (A to C), PLN (D to F), and pancreas (G to I) tissue sections (detailed in table S4) stained with pooled CMV/Flu, pooled CVB or single WNV MMrs (red; see fig. S7), and CD8 (green). Cell nuclei are stained in blue. Scale bars: 20 μm for spleen, 50 μm for CVB PLN, 20 μm for CMV/Flu PLN, 10 μm for WNV PLN, and 50 μm for pancreas. White arrows indicate MMr+CD8+ T cells. (J to K) Bar graphs showing the mean + SD of MMr+ cell densities (number of MMr+ cells/mm2 area) in the spleen (J) and PLNs (K) for CVB, CMV/Flu and WNV specificities in T1D, double-aAb+ (2AB+), and nondiabetic HLA-A2+ (triangles) and HLA-A3+ (circles) donors. **P = 0.008 and *P = 0.05 by Wilcoxon signed rank test.

