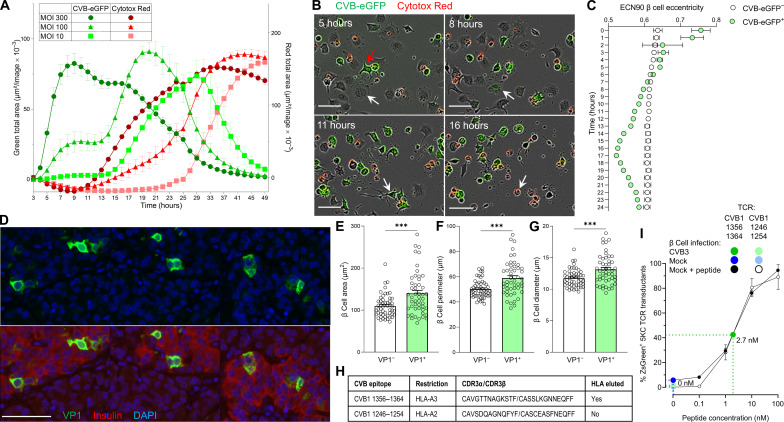
Fig. 6. Kinetics of CVB infection and β cell death and presentation of CVB peptides.
(A) Real-time imaging of infection and death (Cytotox Red) in CVB3-eGFP-infected ECN90 β cells. Infection and death curves are plotted as total area in green and red on the left and right y axes, respectively. Each data point represents mean ± SD of at least duplicate measurements (representative experiment performed in duplicate). (B) Representative images from movie S1 showing an intact β cell (5 hours, white arrow) touching the filopodia of an infected eGFP+ cell (red arrow), turning eGFP+ (8 hours) and subsequently emanating filopodia (11 hours) before dying (Cytotox Red+; 16 hours). Scale bars, 30 μm. (C) Eccentricity of infected versus noninfected ECN90 β cells (300 MOI). Each point represents mean ± SD of 8 images, P < 0.01 at all time points (barring 2 hours) by unpaired Student’s t test. (D) Representative pancreas sections from T1D donor 6243 stained for VP1 (green) and 4′,6-diamidino-2-phenylindole (DAPI; blue), alone (top) or with insulin (red, bottom). Scale bar, 50 μm. (E to G) Comparison of VP1− versus VP1+ β cell area (E), perimeter (F), and diameter (G) in pancreas sections stained as above. Each point represents a β cell from sections of three T1D donors; bars represent mean + SEM. ***P ≤ 0.0004 by unpaired Student’s t test. (H) CVB-reactive TCRs reexpressed in carrier cells. (I) CVB11356–1364-reactive TCR activation in NFAT-driven ZsGreen reporter, TCR-transduced 5KC cells upon an 18-hour coculture with CVB3-infected (dark green; 300 MOI) versus mock-infected ECN90 β cells (dark blue), plotted as mean ± 95% confidence interval of triplicate wells (representative experiment performed in duplicate). A parallel dose-response curve with increasing peptide concentrations pulsed on noninfected β cells (black) estimated the concentration of peptide recognized on CVB-infected β cells to 2.7 nM. A TCR recognizing the CVB11246–1254 peptide (not eluted from β cells) is shown as negative control.

