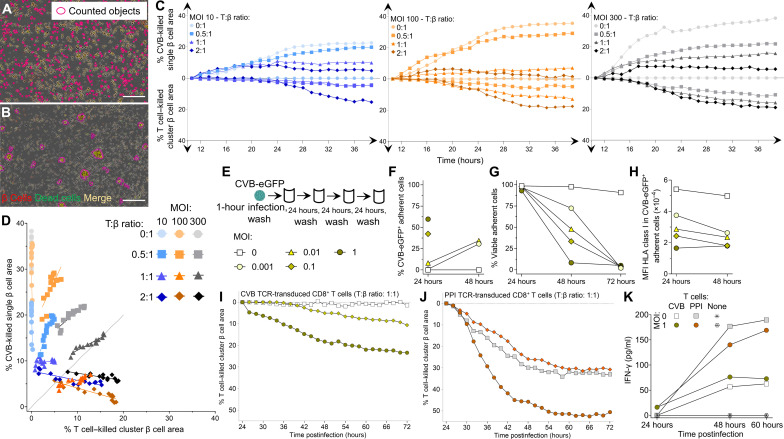
Fig. 7. Infected β cells are more efficiently killed by CVB than by CVB-reactive T cells.
(A and B) Representative real-time images from movies S4 and S5 (300 MOI, 1:1 T:β cell ratio) showing dead (Cytotox Green+) β cells (CellTracker Red+; dead β cells in yellow) killed by CVB (A) and CVB TCR-transduced CD8+ T cells (B), detected by single-cell and cluster analysis masks, respectively (details in movies S2 and S3). Scale bars, 30 μm. (C) Percent CVB-killed single β cell area (top) and T cell–killed cluster β cell area (bottom) at different MOIs and T:β cell ratios (ECN90 β cells stained as above), expressed as median percent total area from at least duplicate wells, normalized to the 8-hour time point (representative experiment performed in duplicate). (D) Correlation between percent CVB-killed and T cell–killed β cell area from (C) during the last 24 hours (details in fig. S8). (E) Low-grade infection protocol. ECN90 β cells were incubated with CVB3-eGFP for 1 hour, washed, and cultured for 72 hours, with washes to remove free virions, cell sampling for flow cytometry, and medium replenishment every 24 hours. (F to H) Percent CVB3-eGFP+ adherent ECN90 β cells (F), percent viable adherent cells (G), and HLA-I MFI (H). Each point represents the mean of duplicate measurements. For (F) and (H), some time points are not depicted due to the low number of remaining viable cells. (I and J) Percent T cell–killed cluster β cell area following 1-hour infection, washing, 24-hour culture, and real-time imaging after addition of CVB11356–1364 (I) or PPI15–24 (J) TCR-transduced CD8+ T cells (1:1 T:β ratio). β cell areas are expressed as median percent of total β cell area from at least duplicate wells, normalized at the 24-hour time point [symbol legends as in (E), depicted in different colors for (J)]. (K) Mean IFN-γ secretion from the same duplicate wells.

