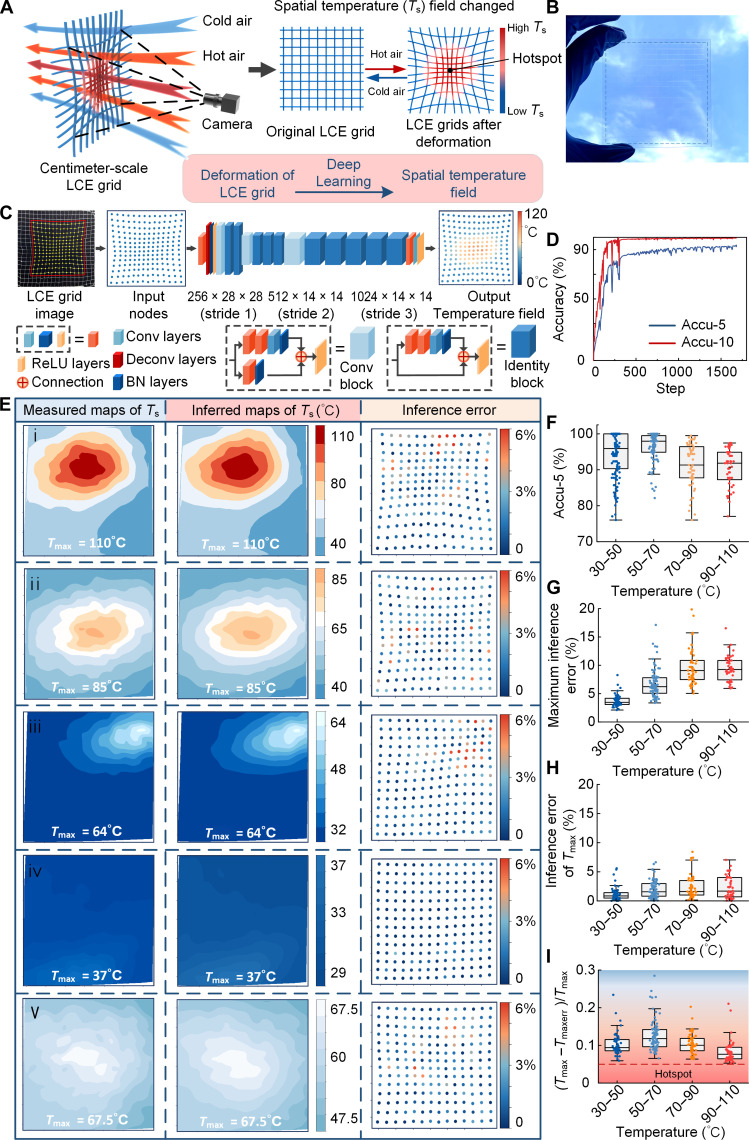
Fig. 5. The LCE grid–based, large-scale, real-time, and high-precision STF sensor.
(A) Schematic diagram of the STF sensor based on LCE grids. (B) Photograph of the LCE grid printed on a glass substrate. (C) The inference process of the temperature field was performed using an integrated DL model. (D) ACCU-5 and ACCU-10 curves in the DL model training process. Accu-5 and Accu-10 are defined as evaluation metrics of inference accuracy. (E) Measured temperature contour maps, inferred temperature contour maps of the STF sensor, and inference error dot plots of the STF sensor. (F to I) STF sensor performance on the test dataset. (F) Boxplot of inference accuracy (Accu-5) of the STF sensor. (G) Boxplot of maximum inference error of the STF sensor. (H) Inference error boxplot of the highest-temperature node. (I) The boxplot illustrates the proximity between the highest-error nodes and the highest-temperature nodes. (Tmax − Tmaxerr)/Tmax is defined as a temperature difference between the highest-temperature node and the highest-error node divided by the highest temperature. The term “hotspot” is defined as a high-temperature zone where the temperature difference does not exceed 5% of the Tmax value.

