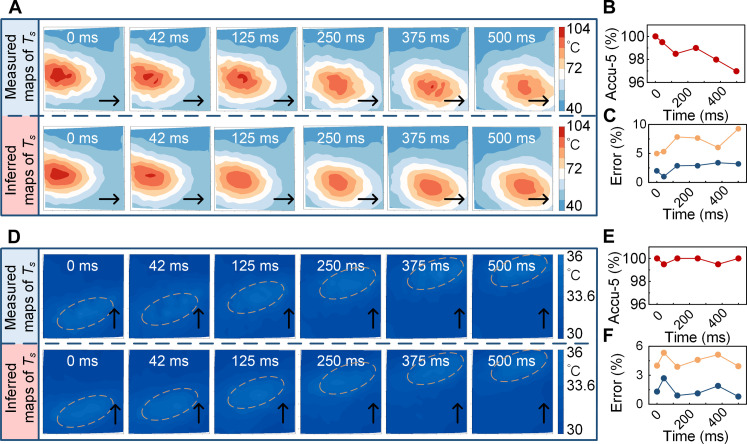
Fig. 6. The rapid response testing of the STF sensor.
(A) Rapid response performance of the STF sensor when the high-temperature airflow swiftly moves from left to right within 500 ms. (B) Real-time accuracy of the STF sensor when the high-temperature airflow moves fast. The measurement accuracy consistently exceeds 96%. (C) Real-time error of the STF sensor when the high-temperature airflow moves fast. The yellow line represents the maximum inference error of the temperature field contour map, and the blue line represents the inference error of the highest-temperature node in the temperature field contour map. (D) Rapid response performance of the STF sensor when the low-temperature airflow swiftly moves from left to right within 500 ms. (E) Real-time accuracy of the STF sensor when the low-temperature airflow moves fast. The measurement accuracy consistently exceeds 99.5%. (F) Real-time error of the STF sensor when the low-temperature airflow moves fast. The yellow line represents the maximum inference error of the temperature field contour map, and the blue line represents the inference error of the highest-temperature node in the temperature field contour map.

