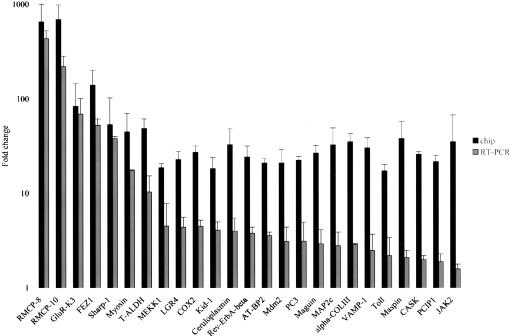
Figure 1.
Microarray chip and quantitative RT–PCR data showing genes that are up-regulated in the mutant R3-2 line. FC ratios obtained from the chip analysis are mean of the five or more pairwise comparisons between the mutant R3-2 line and the wild-type Rat2 cells. The FC ratio between the mutant line and the control wild-type cells detected in the RT–PCR analysis are median copy numbers normalized to GAPDH copy numbers for each gene. The RT–PCR results shown for each transcript are typical of those obtained in duplicate using RNA from at least two independent preparations.

