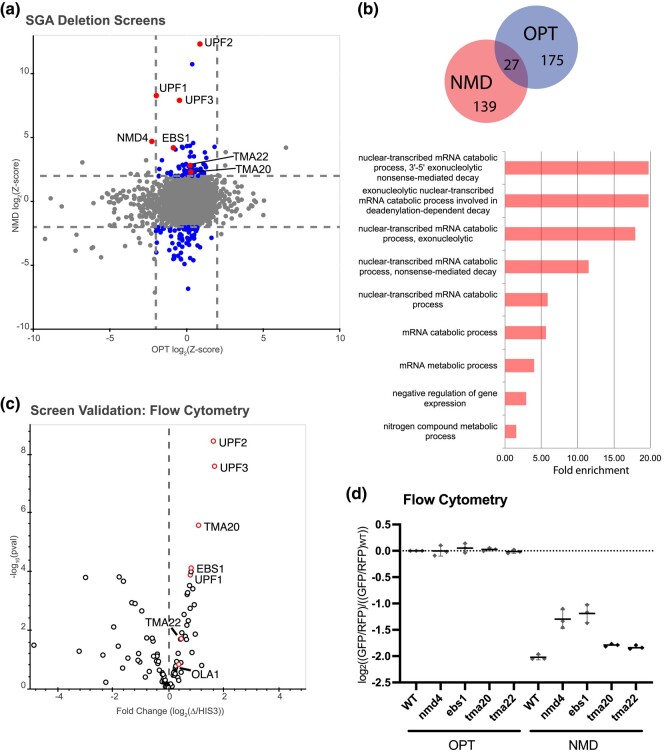
Fig. 2.
Yeast SGA screens identify genes important for repression of NMD targets. a) Plot of Z-scores from OPT reporter deletion screen vs the NMD reporter deletion screen. Z-scores reflecting the significance of log2(GFP/RFP) values from each deletion strain are plotted against each other for the 2 different GFP reporters. Dashed lines represent cutoffs at a Z-score greater than 2 or less than −2 for each reporter. Highlighted dots represent deletion strains that have a Z-score value outside the cutoff for the NMD reporter, but not for the OPT reporter. Labeled dots identify the strains known to affect NMD and/or strains of interest in this study. b) (Top) Venn diagram showing the overlap between the OPT screen hits and the NMD screen hits. (Bottom) GO enrichment terms for cellular processes identified from the NMD hits performed using GOrilla software. Note: GO analysis for the OPT reporter hits were insufficient to yield enrichment data. c) Volcano plot showing data from a follow-up screen using newly constructed yeast strains and flow cytometry. The x-axis compares the fold change of individual deletion strains to the control HIS3-deletion strain. Data for each dot were obtained in triplicate and P-values are plotted on the y-axis. Red dots identify the strains known to affect NMD and/or strains of interest in this study. d) Individual averages of 3 different flow cytometry experiments performed on the indicated strains with the indicated reporters are shown. The GFP/RFP signal for each given strain normalized to the WT strain with the OPT reporter is plotted.

