Figure 2.
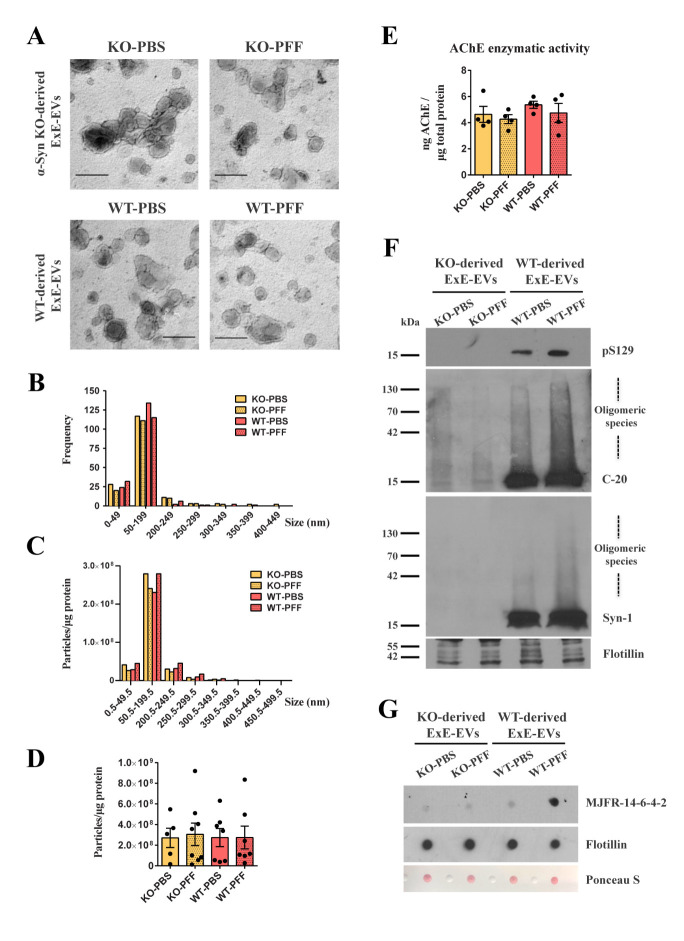
Characterization of exosome-enriched fraction C isolated from PFF-injected WT and α-Syn KO mouse brains, at one-month post-inoculation. (A) Representative high magnification EM images of exosome-enriched fraction C isolated from the PFF-injected WT and α-Syn KO mice and their respective PBS controls (34,000x, scale bar 200 nm). (B) Quantification graph of the EM images depicting the size distribution of the isolated fraction C shown in panel A. y-axis represents the frequency of the different size groups shown along the x-axis. (C) Graph demonstrating the size distribution of the isolated fraction C, as measured by NTA. y-axis represents the number of particles/μg of total protein of the different size groups shown along the x-axis. (D) Graph depicting the total number of particles/μg of total protein corresponding to the 4 experimental groups. Data represent mean values ± SEM (n = 5-8 independent brain exosome preparations/ group). (E) Graph depicting the concentration of AChE enzyme (ng) contained in the four groups of isolated fraction C (KO-PBS, KO-PFF, WT-PBS, WT-PFF), normalized to the total protein content (μg) measured by Bradford assay. Data represent mean values ± SEM (n = 4 independent brain exosome preparations). (F) Western blot analysis of the isolated fraction C for the presence of phospho- (pS129) and total α-Syn (C-20, Syn1). The exosome marker flotillin was used as a loading control. (G) Dot blot analysis of the brain-derived fraction C against MJFR-14-6-4-2, a specific antibody recognizing α-Syn aberrant forms. Equal loading was assessed by blotting against flotillin and Ponceau-S staining. Two-way ANOVA, was used in all panels. ExE-EVs: Exosome Enriched Extracellular Vesicles, EM: Electron Microscopy, ΝΤΑ: Nanoparticle Tracking Analysis, AChE: Acteylcholinesterase.

