Figure 4.
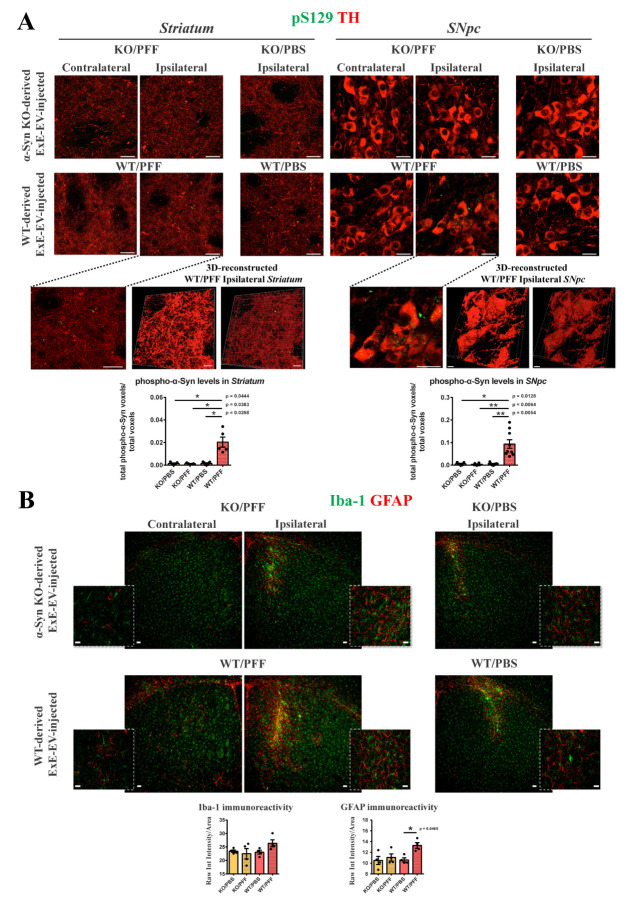
Assessment of α-Syn pathology in the nigrostriatal axis of WT mice inoculated with isolated brain ExE-EVs, at two-months post-injection. WT mice were stereotactically injected with 5.5 μg of brain-derived exosomes in the right dorsal striatum. (A) Representative confocal images showing double immunostaining against phospho-α-Syn (green, pS129) and TH (red) in the contralateral and ipsilateral striatum (left panels) and SNpc (right panels) of ExE-EV-injected WT mice, [(63x, scale bar, 20 μm)]. 3D reconstruction with Imaris software of the confocal images from the ipsilateral striatum and SNpc of the WT/PFF ExE-EV-injected mice, verify the presence of phospho-α-Syn species within the TH positive fibers [(bottom left, 63x, scale bar 20 μm, 3D reconstructed images scale bar 10 μm)] and cell somata [(bottom right, 63x, scale bar 20 μm, 3D reconstructed images scale bar 5 μm)]. Quantification graphs depicting the total volume (voxels) of phospho-α-Syn in the striatum (left) and SNpc (right) normalized to the total image volume, following analysis with Imaris software, (n = 5-9 animals per group). Data represent mean values ± SEM. (B) Representative confocal images of Iba-1 (green) and GFAP (red) in the contralateral and ipsilateral striatum of WT mice inoculated with KO/PFF (upper panels) or WT/PFF ExE-EVs (lower panels), two-months post-injection [(Low magnification 10x, scale bar 50 μm, high magnification 63x, scale bar 20 μm)]. Graphs illustrate the quantified micro- (left) and astro-gliosis (right), estimated as the ratio of the Raw Integrated intensity of Iba-1 and GFAP, respectively, normalized to the section area. (n =3-4 animals per group). Data represent mean values ± SEM. Kruskal-Wallis, followed by Dunn’s test, was used in all panels. 3D: 3 dimensional.

