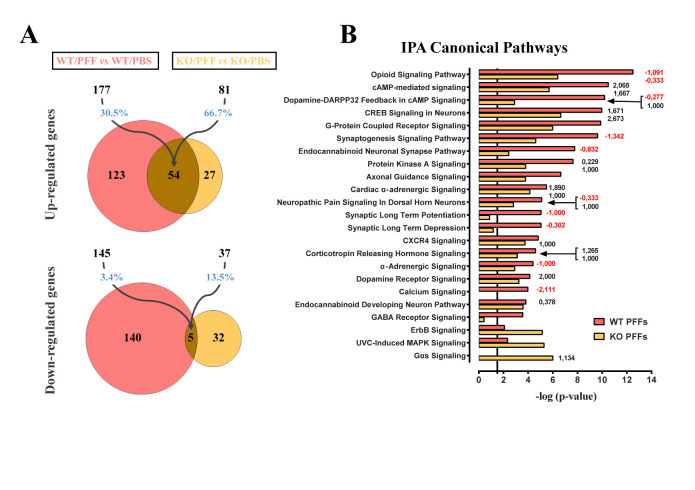
Figure 5.
Alterations in the transcriptomic profiling of WT mouse striatum, two-months post-inoculation with brain-derived ExE-EVs. (A) Venn diagrams summarizing RNA-Seq analysis results of the ipsilateral WT striatal tissues. Numbers of statistically significant (base Mean > 30 and FDR < 0.1) up- or down-regulated genes following inoculation with WT/PFF (pink) and KO/PFF (yellow) ExE-EVs, in comparison to their respective PBS controls, are depicted. The indicated percentages highlight the overlap between the two ExE-EV groups. (B) Graph demonstrating on the y-axis the CNS-related IPA canonical pathways, selected among the top 45 from RNA-Seq analysis and on the x-axis the statistical significance [-log (P value)]. The black vertical line is indicative of the threshold for statistical significance (P = 0.05). Numbers at the right side of the bars represent calculated IPA z-scores predicting an increased (black numbers) or a decreased (red numbers) pathway activity. FDR: false discovery rate (adjusted p-value), RNA-Seq: RNA-Sequencing.

