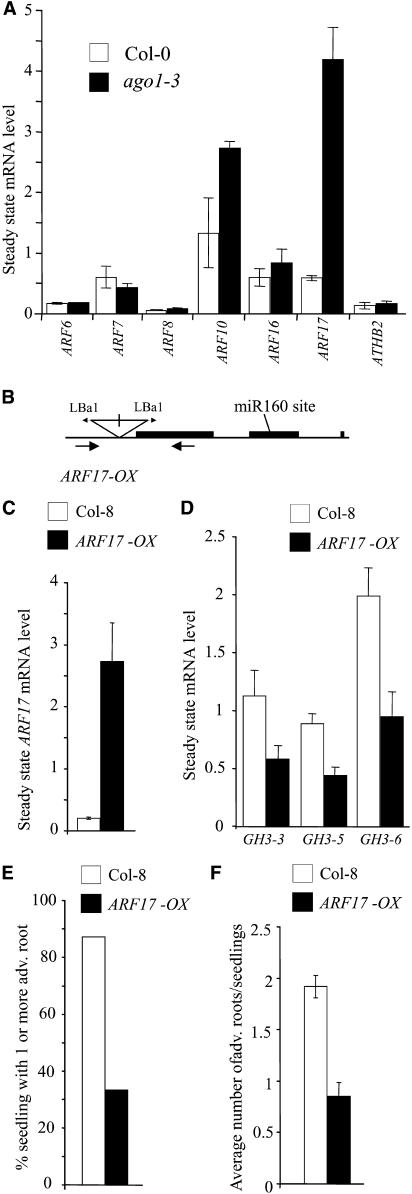
Figure 10.
The Auxin Response Factor ARF17 Represses GH3 Genes and Adventitious Root Formation.
(A) Total RNAs were extracted from hypocotyls of Col-0 and ago1-3 siblings etiolated in the dark for 2.5 d and then transferred for 48 h into the light. The indicated mRNAs were quantified by real-time quantitative PCR using primers surrounding putative miRNA cleavage sites. ATHB2 and ARF7 were used as controls not targeted by miRNAs. Expression for each gene was normalized to that of ACTIN2. Error bars indicate se of two independent biological replicates.
(B) Scheme of the ARF17 OX T-DNA insertion line SALK 062511. Black boxes represent CDS, lines represent introns, untranslated regions, or promoters. The positions of the inverted repeat T-DNA insertion and left border primers (Lba1) are indicated. Approximate positions of the genomic primers used in genotyping are indicated with arrows below the transcript.
(C) Relative abundance of ARF17 transcript in ARF17 OX and Col-8 hypocotyls etiolated for 2.5 d and exposed to light for 2 d. Expression for the gene was normalized to that of ACTIN2. Quantification was made by real-time quantitative PCR using primers surrounding the putative miRNA cleavage site. Error bars indicate se of two independent biological replicates.
(D) Relative abundance of GH3-3, GH3-5, and GH3-6 transcripts in ARF17 OX and Col-8 hypocotyls etiolated for 2.5 d and exposed to light for 2 d. Quantification was performed using semiquantitative RT-PCR as described in Methods. Expression for the genes was normalized to that of 18S rRNA. Error bars indicate se of three independent RT-PCR replicates (P < 0.01). These experiments were repeated on two independent biological replicates.
(E) Proportion of wild-type and ARF17 OX siblings developing one or more adventitious roots after etiolation and transfer to the light for 1 week.
(F) Average number of adventitious roots formed on ARF17 OX and Col-8 after etiolation and transfer to the light for 1 week. Error bars indicate se (P < 0.01; n > 30). Observations were done on three independent biological replicates.

