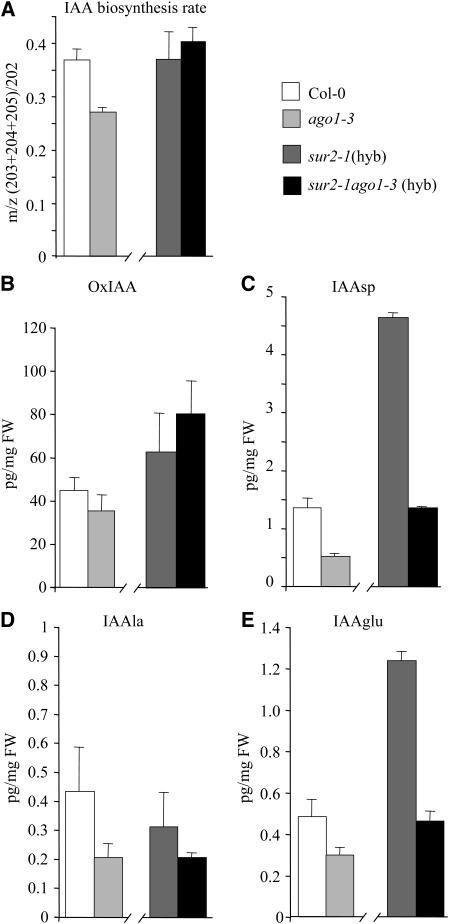
Figure 7.
IAA Biosynthesis Rate and Level of IAA Metabolites in Col-0, ago1-3, sur2-1(hyb), and ago1-3 sur2-1(hyb) Seedlings.
(A) IAA biosynthesis rate in the apical part of seedlings (hypocotyl plus cotyledons), 72 h after transfer to the light. Four replicates were used for each data point. Error bars indicate sd.
(B) to (E) Quantification of IAA metabolites. Measurements were performed on entire seedlings grown for 2.5 d in the dark for oxoindole-3-acetic acid (B), N-(indole-3-acetyl)-Asp (C), N-(indole-3-acetyl)-Ala (D), and N-(indole-3-acetyl)-Glu (E). Four replicates were used for each data point. Error bars indicate sd. FW, fresh weight.

