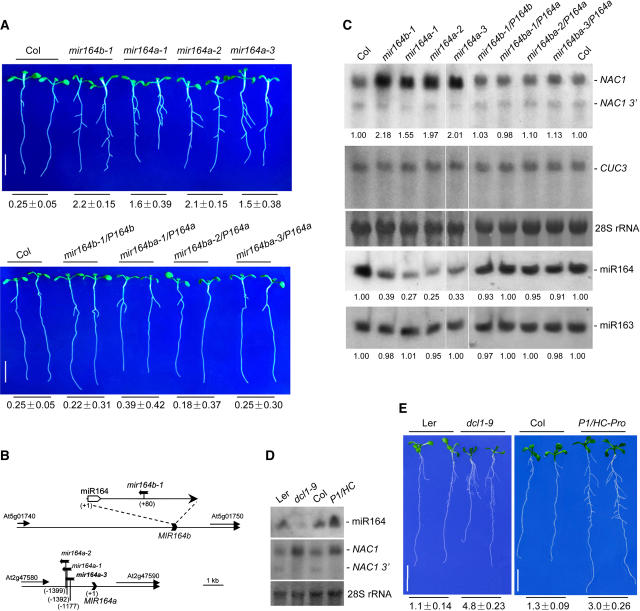
Figure 5.
RNA Gel Blot Analysis and Root Phenotypes of mir164a and mir164b Mutants, dcl1-9 Mutant, and P1/HC-Pro Transgenic Plants.
(A) Root phenotypes of wild-type Col, mir164a, and mir164b mutants (top) and of complemented lines (bottom). Seedlings were photographed 10 d after germination on MS medium with 2% sucrose. Bars = 1 cm.
(B) T-DNA insertion sites of mir164b-1, mir164a-1, mir164a-2, and mir164a-3 relative to the annotated genes.
(C) RNA analysis of mir164a and mir164b mutants and complemented lines. Ten micrograms of total RNA (top gel) or low-molecular-weight RNAs (fourth gel) from roots of 10-d-old seedlings was loaded and hybridized with the appropriate probes as described for Figure 1. The filters were then stripped and rehybridized with a CUC3 3′ gene-specific sequence (nucleotides 1273 to 1863; second gel) or with a 5′ end-labeled DNA oligonucleotide complementary to miR163 (fifth gel) to serve as loading controls. 28S rRNA was used as a total RNA loading control (third gel). For each plant line, the relative accumulation levels of full-length NAC1 mRNA, miR164, and miR163 are indicated below the lanes. Levels in wild-type Col were arbitrarily designated as 1.00.
(D) and (E) RNA analysis and root phenotypes of the dcl1-9 mutant and P1/HC-Pro transgenic plants. dcl1-9 (Ler) and P1/HC-Pro (Col) transgenic seedlings and their respective wild-type controls were grown on MS medium with 2% sucrose for 2 weeks.
(D) Root RNA was analyzed as described for Figure 1 using 10 μg of low-molecular-weight RNAs (top gel) or 3 μg of total RNA (middle gel). 28S rRNAs bands were used as loading controls (bottom).
(E) Representative plants were photographed. dcl1-9 and P1/HC-Pro seedlings were identified by their developmental phenotypes. Bars = 1 cm.
Numbers below (A) and (E) indicate the number of lateral roots per centimeter of primary root (average ± se) as described for Figure 3B (n = 20).

