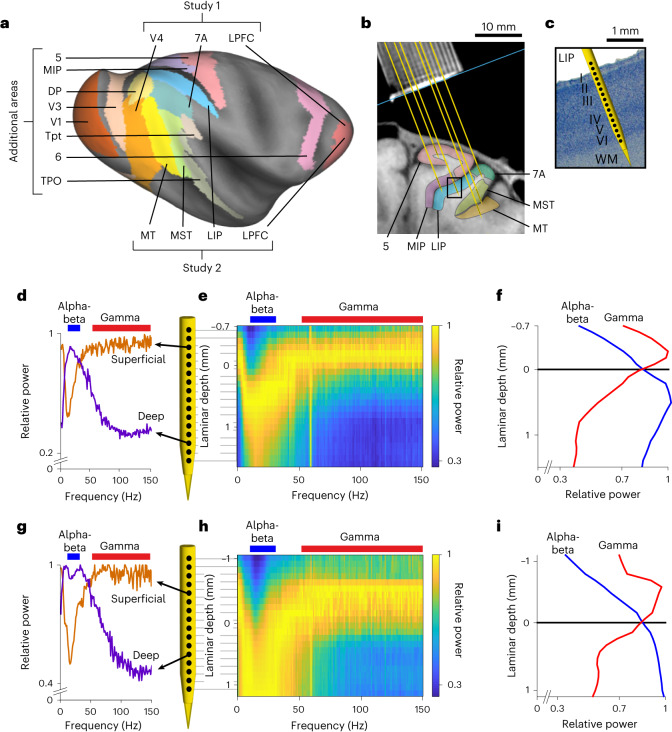
Fig. 1. Laminar recording methods and laminar differences in LFP oscillatory power.
a, Inflated cortical surface of the macaque brain showing cortical areas recorded depicted using Caret software60 on the F99 template brain and using Lewis and van Essen61 area parcellation scheme. b, Structural MRI nearly-coronal section of one monkey from study 2 showing recording chamber grid (top) and location of areas MT, MST, 7A, 5, MIP and LIP on the right hemisphere. Yellow lines show the locations of example probes in all areas. c, Nissl section from the same monkey corresponding to a ×10 magnification of the black rectangular region in b with an example probe diagram showing the locations of recording channels (black dots) with respect to the cortical layers in area LIP. WM, white matter. d,g, Relative power as a function of frequency in a superficial-layer channel and a deep-layer channel from two example probes in areas LIP (d) and MT (g). e,h, Relative power maps for the two example probes. f,i, Relative power averaged in the alpha-beta (blue) and gamma (red) frequency bands as a function of laminar depth for the two example probes. Laminar depths are measured with respect to the alpha-beta/gamma crossover.

