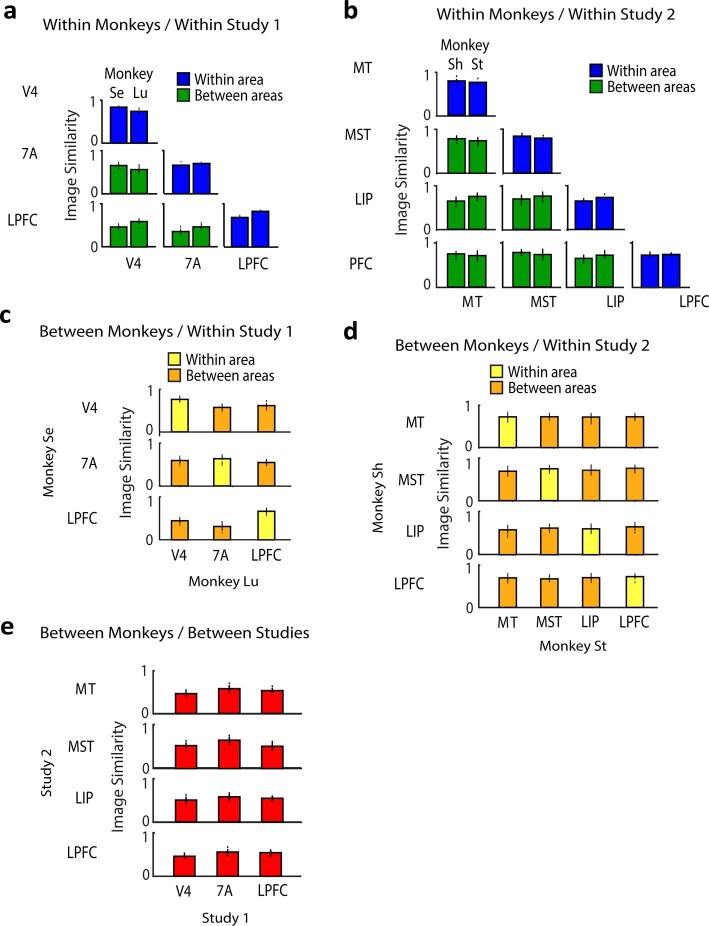
Extended Data Fig. 2. Image similarity values between relative power maps within and between cortical areas, monkeys, and studies.
(a, b) Mean image similarity of relative power maps across probe recordings within (blue) and between (green) areas within each monkey within Study 1 (a) and Study 2 (b). (c, d) Mean image similarity within (yellow) and between (orange) areas between monkeys within Study 1 (c) and Study 2 (d). (e) Mean image similarity between areas, between monkeys and between studies. In all panels, the height of each bar corresponds to the mean image similarity across all randomized probe splits (shown as individual dots; see Methods). In all panels, n = 5 probe splits for within-area comparisons, and n = 20 probe splits for between-areas comparisons.

