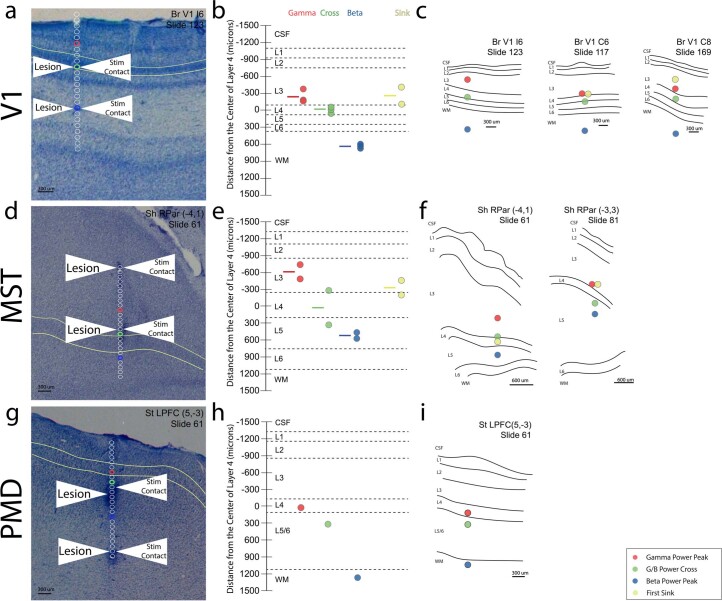
Extended Data Fig. 4. Histological results and examples from V1, MST, and PMD.
(a) Example histological slice from V1. Identification of electrolytic lesions allows reconstruction of all channels of the laminar probe, shown as open circles. Red circle represents probe contact with gamma power peak, green circle represents cross-over, and blue circle represents alpha-beta peak. Green curves lines demarcate layer 4. (b) Population results from V1 histological reconstruction (n = 5). Gamma peak (red), cross-over (green), alpha-beta peak (blue), and CSD early sink (yellow) are shown as distances from center of anatomically-determined layer 4. Negative values indicate more superficial locations, towards layer 1 and CSF (cerebrospinal fluid). (c) Individual anatomical probe reconstructions for primary visual cortex. (d–f) Example histological slices and reconstructed electrophysiological results from middle superior temporal area (MST). (g–i) Example histological slice and reconstructed electrophysiological results from dorsal premotor cortex (PMD). Scale bars are indicated in each subplot with black horizontal lines.

