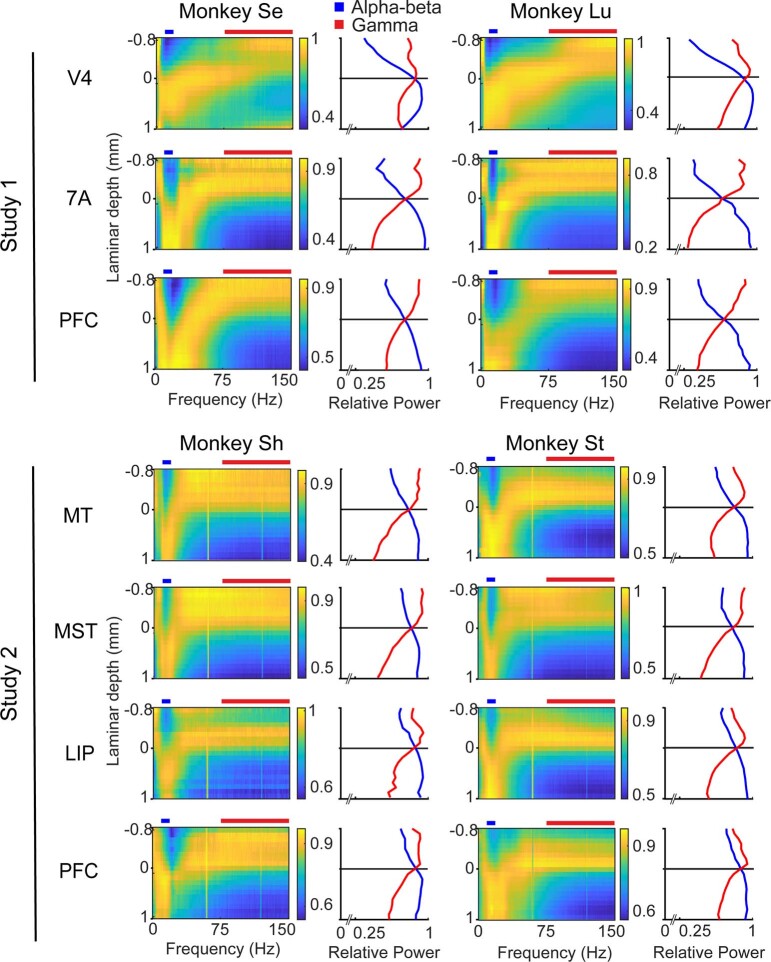
Extended Data Fig. 5. Spectrolaminar patterns as identified by FLIP.
Across-probes average relative power maps (left) and average alpha-beta (blue) and gamma (red) relative power (right) for each area, monkey, and study. The selection of probes with identifiable spectrolaminar pattern, and the alignment of all probes by their cross-over channel, were performed by FLIP and were fully automated. The quality of the average spectrolaminar patterns is comparable or superior to that obtained with the manual identification method (Fig. 2).

