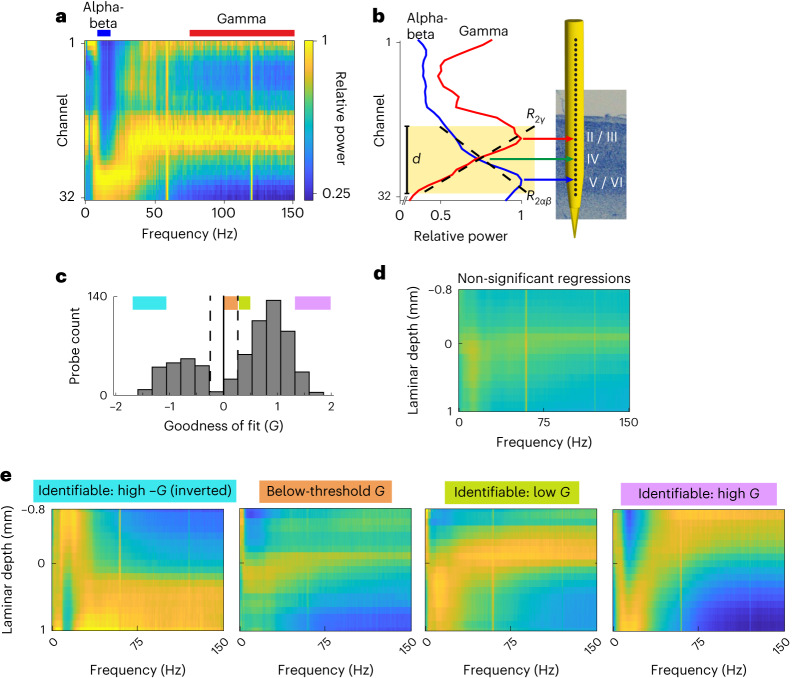
Fig. 5. Automatic FLIP.
a,b, FLIP steps for an example probe. First, FLIP automatically computes the relative power map (a) and the mean relative power across the alpha-beta (10–19 Hz, blue) and gamma (75–150 Hz, red) optimal bands. Then, it identifies the channel range d where the G value of the alpha-beta and gamma relative power regressions (dashed black lines) is maximal (b). Finally, it identifies the alpha-beta peak (blue arrow), gamma peak (red arrow) and crossover (green arrow) channels as markers for layers 5/6, 2/3 and 4, respectively. c, Histogram showing distribution of G across all probes. Dashed lines, ±G threshold. d, Mean relative power map across all probes with non-significant alpha-beta and gamma relative power regressions. e, Mean relative power map across probes within each of the four colored ranges of G shown in c.

