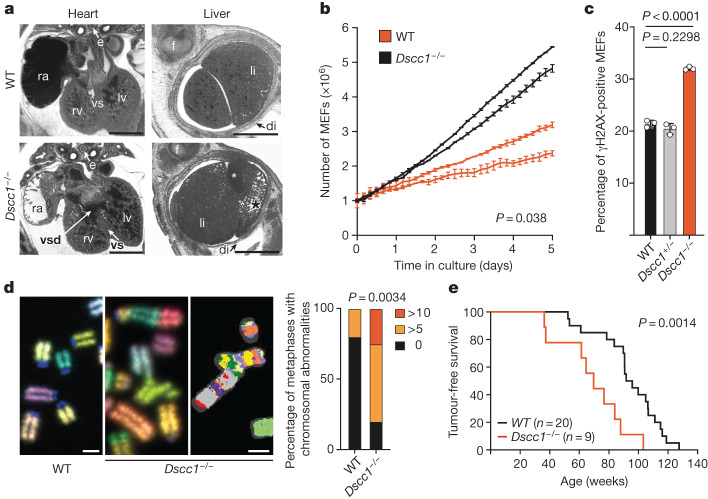
Fig. 2. Loss of Dscc1 leads to early developmental defects and increased genomic instability.
a, Heart and liver abnormalities in Dscc1−/− E14.5 mouse embryos. The axial section (left; dorsal to the top) and sagittal re-sections (right; ventral to the top) were obtained through high-resolution episcopic microscopy (HREM) analysis of a Dscc1-mutant (bottom) and a WT (top) embryo. Bottom left, a ventricular septal defect (vsd) in a Dscc1−/− embryo. Bottom right, abnormal liver texture, specifically, a cyst (white asterisk) and abnormally enlarged liver sinusoids combined with a reduced number of hepatocytes (black asterisk) in the liver lobe of a Dscc1−/− embryo. di, diaphragm; e, oesophagus; li, liver; LV, left ventricle; RA, right atrial appendix; RV, right ventricle; VS, ventricle septum. Scale bars, 1 mm. Three embryos per genotype were analysed. b, Growth curves of primary mouse embryonic fibroblasts (MEFs) over 5 days in culture. Two independent WT and two independent Dscc1−/− MEF lines derived from littermate embryos are shown. n = 3 independent replicates each. Data are mean ± s.d. Statistical analysis was performed using two-tailed Student’s t-tests comparing the area under the curve (AUC) values. c, Flow cytometry analysis of MEFs, showing increased genomic instability, as measured by the presence of γH2AX-positive cells, an indicator of the presence of DNA damage. n = 3 biological replicates each. Data are mean ± s.d. Statistical analysis was performed using two-tailed Student’s t-tests. d, Representative images of chromosomal abnormalities seen in primary MEFs of the indicated genotypes at passage 3 (left). Right, the percentage of abnormalities from chromosomal spreads comparing WT with Dscc1−/− MEFs. n = 3 biological replicates measuring n = 10 metaphases per genotype in each experiment. Statistical analysis was performed using two-way analysis of variance. Scale bars, 5 µm. e, Kaplan–Meyer analysis of Dscc−/− mice, showing that they have a decreased latency of tumour formation. Age and sex information are in provided in the Source Data. n = 20 (WT) and n = 9 (Dscc1−/−) mice. Statistical analysis was performed using log-rank (Mantel–Cox) tests.

