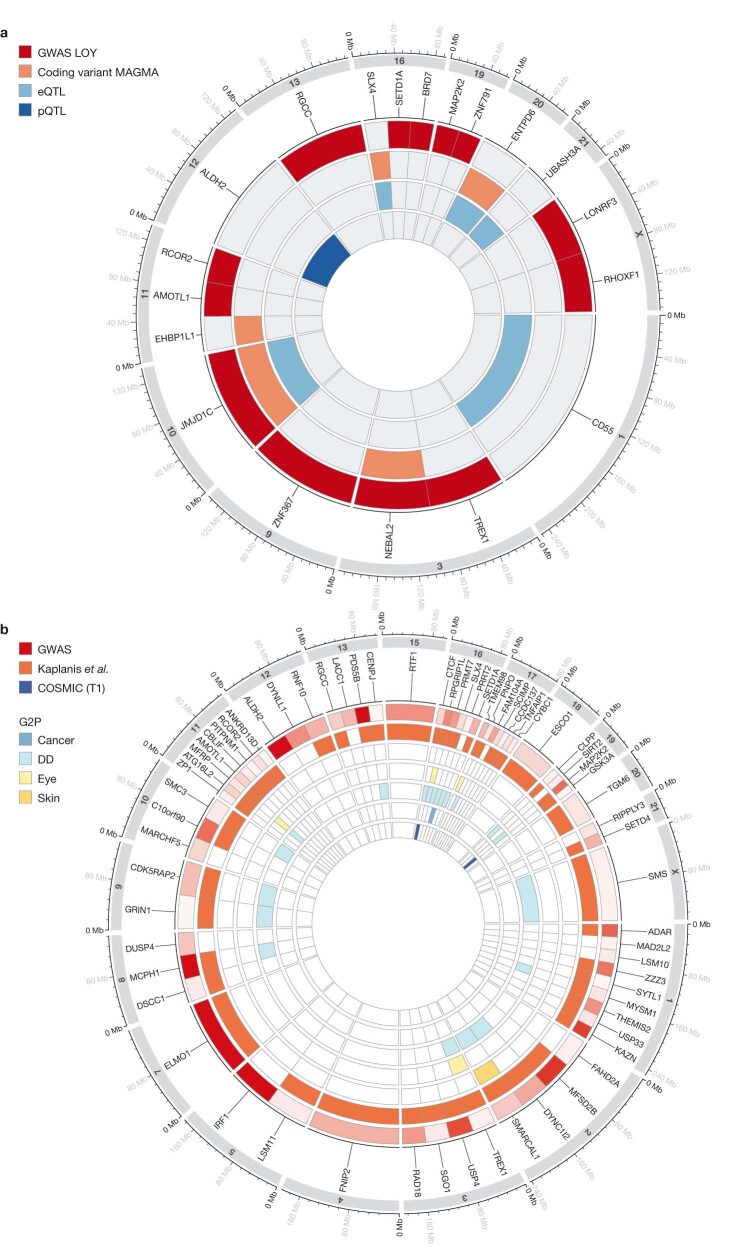
Extended Data Fig. 2. Integration of MN hits with human genome-wide association (GWAS) and other genetic studies.
a, Circos plot showing the overlap between the mouse MN genes and human genetic datasets. The outer concentric circle (red) indicates whether the listed gene is proximal to a signal in the loss-of-Y (LOY) GWAS26. The orange circle indicates whether there was a significant gene-level association between LOY and gene variants with predicted deleterious effects. Light blue indicates co-localization between GWAS and mRNA levels in the blood for the listed gene and dark blue, equivalently for blood protein levels. Corresponding results can be found in Supplementary Table 2. b, Circos plot showing the overlap between the +MN genes identified in mice and human disease datasets. Corresponding results can be found in Supplementary Table 3. G2P: genes to phenotypes29. GWAS: GWAS Catalog. COSMIC (T1): COSMIC Tier 1 cancer genes30. Kaplanis et al., ref. 31; DD, developmental disorders (see Methods). In the outer ring the “redness” denotes the number of associations with genes in the GWAS catalogue. Where there are multiple genes on a chromosome, we segmented the chromosome into equal bins.

