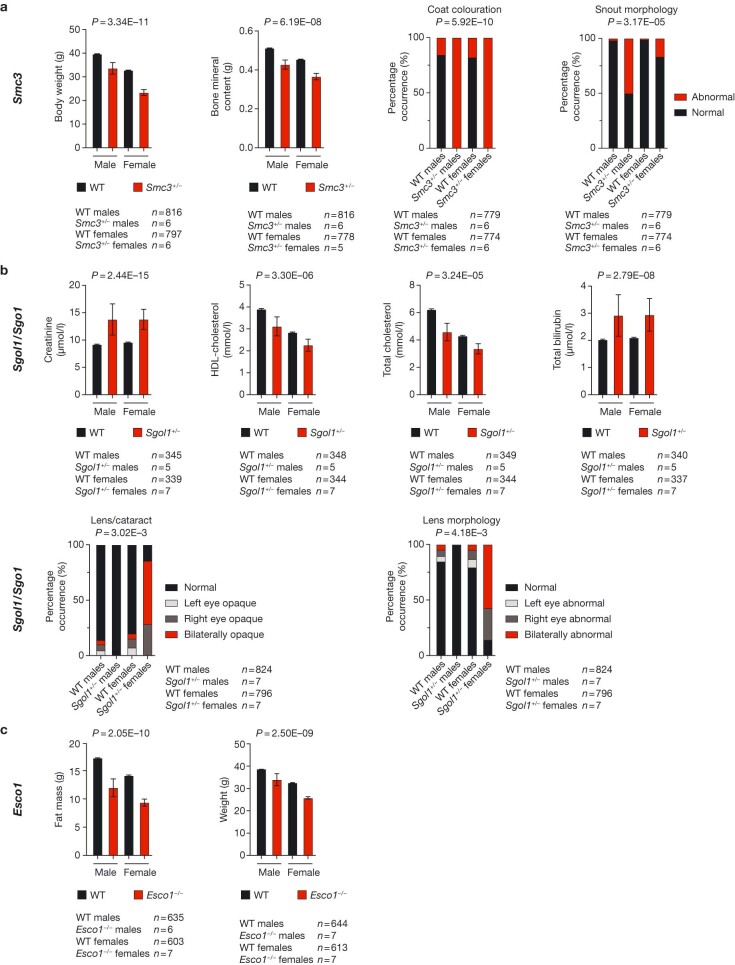
Extended Data Fig. 3. Phenotypic analysis of mouse mutants related to cohesion defects.
Bar graphs showing selected significant phenotypic differences for the cohesin-related mouse lines Smc3 (a), Sgol1/Sgo1 (b) and Esco1 (c). The individual mouse was considered the experimental unit within the studies. The mean is shown with error bars denoting the s.d. The numbers of mice and statistical methods used are detailed on the IMPC website59. P values were calculated depending on the data type (continuous or categorical) within the Phenstat Package in R (version 3.18) which deploys linear mixed modelling (10.18129/B9.bioc.PhenStat) or using Fisher’s tests (for categorical data). These statistical methods are available in the phenotyping file on Github/Figshare and are also available on the IPMC database website59. The data presented are a snapshot from September 2023 (see Methods) as part of IMPC release 19.

