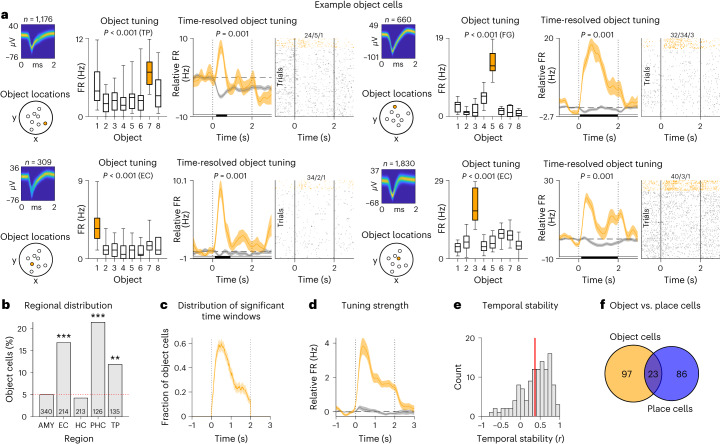
Fig. 5. Neurons in the human MTL encode specific objects.
a, Example object cells. For each cell, from left to right: action potentials as density plot; locations of the objects in the environment; absolute firing rates in response to the different objects during the cue period (statistics are from one-sided permutation tests, using a total of n = 1,176, 660, 309 and 1,830 action potentials during all cue periods, respectively); time-resolved firing rates (baseline corrected relative to −1 s to 0 s before cue onset) for the preferred and the unpreferred objects (error bands, ±s.e.m.); and spike raster for all trials. Time 0, cue onset. Orange, data for the preferred object; gray, data for unpreferred objects. Box plots show center line, median; box limits, upper and lower quartiles; and whiskers, minimum and maximum. Black shading below the time-resolved firing rates, significant difference between firing rates (one-sided cluster-based permutation test: P < 0.05). b, Distribution of object cells across brain regions; red line, 5% chance level. Object cells were significantly prevalent in the entorhinal cortex, parahippocampal cortex and temporal pole (two-sided binomial tests versus chance with Bonferroni correction for multiple comparisons: Pcorr. < 0.001, Pcorr. < 0.001 and Pcorr. = 0.006, respectively). c, Distribution of significant time windows across object cells (mean ± s.e.m.). d, Tuning strength across object cells (mean ± s.e.m.). Orange, data for the preferred object; gray, data for unpreferred objects. e, Temporal stability of object cell tuning. Red line, mean. f, Overlap between object and place cells. AMY, amygdala; EC, entorhinal cortex; FG, fusiform gyrus; HC, hippocampus; PHC, parahippocampal cortex; TP, temporal pole. **Pcorr. < 0.01 and ***Pcorr. < 0.001.

