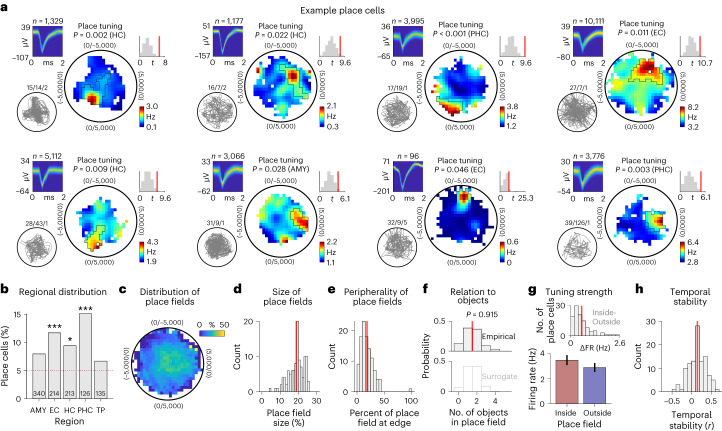
Fig. 6. Neurons in the human MTL encode specific spatial locations.
a, Example place cells. For each cell, from left to right: action potentials as density plot; navigation path of the participant through the environment (gray line); smoothed firing rate map (unvisited areas are shown in white); empirical t-statistic (red line) and surrogate t-statistics (gray histogram) from two-sided unpaired t-tests (using a total of n = 1,329, 1,177, 3,995, 10,111, 5,112, 3,066, 96 and 3,776 action potentials, respectively); and color bar, firing rate. b, Distribution of place cells across brain regions; red line, 5% chance level. Place cells were significantly prevalent in the entorhinal cortex, hippocampus and parahippocampal cortex (two-sided binomial tests versus chance with Bonferroni correction for multiple comparisons: Pcorr. < 0.001, Pcorr. = 0.034 and Pcorr. < 0.001, respectively). c, Spatial distribution of the place fields of all place cells (in percent relative to the spatial distribution of the firing rate maps). d, Histogram of place field sizes. Place field sizes are expressed in percent relative to the sizes of the firing rate maps by dividing the number of spatial bins being part of the place field by the number of spatial bins being part of the firing rate map. Unoccupied spatial bins are ignored. Red line, mean. e, Histogram of place field fractions that were next to the edges of the firing rate maps, quantifying the peripherality of the place fields. Red line, mean. f, Histogram of the number of objects inside place fields. The number of objects inside empirical place fields (top) is not increased as compared to surrogate place fields (bottom; two-sided two-sample Kolmogorov–Smirnov test). Red line, mean. g, Firing rate of place cells inside versus outside the place fields (n = 109 place cells). Bars and error bars show mean ± s.e.m. Histogram at top shows the distribution of cell-wise differences in firing rates inside minus outside the place fields (ΔFR). h, Temporal stability of the firing rate maps of place cells; red line, mean. AMY, amygdala; EC, entorhinal cortex; HC, hippocampus; PHC, parahippocampal cortex; TP, temporal pole. *Pcorr. < 0.05 and ***Pcorr. < 0.001.

