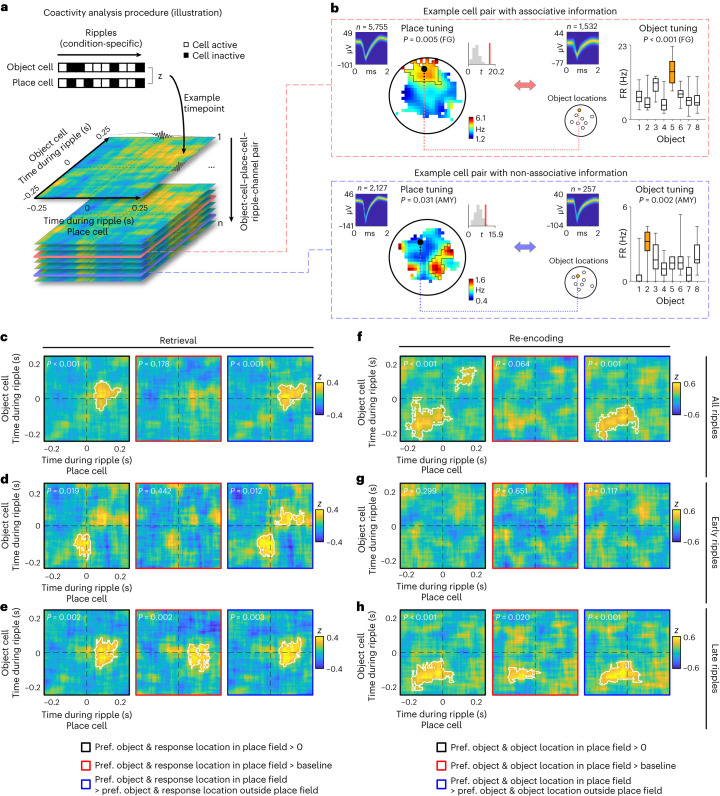
Fig. 7. Ripple-locked coactivity of object and place cells during the retrieval and formation of associative memories.
a, Analysis of ripple-locked coactivity of object and place cells (illustration). b, Example pairs of object and place cells with associative and non-associative information. For both place cells, from left to right: action potentials as density plot; smoothed firing rate map (unvisited areas are shown in white); empirical t-statistic (red line) and surrogate t-statistics (gray histogram) from two-sided unpaired t-tests (using a total of n = 5,755 and 2,127 action potentials, respectively); and color bar, firing rate. For both object cells, from left to right: action potentials as density plot; locations of the objects in the environment; and absolute firing rates in response to the different objects during the cue period (statistics are from one-sided permutation tests, using a total of n = 1,532 and 257 action potentials during all cue periods, respectively). Orange, data for the preferred object; gray, data for unpreferred objects. Box plots show: center line, median; box limits, upper and lower quartiles; and whiskers, minimum and maximum. c, Coactivity maps estimated using all ripples during retrieval periods, considering only trials in which the participant is asked to remember the location of the preferred object of the object cell and in which the participant’s response location is inside the place field of the place cell. Left, comparison of the coactivity maps against chance (that is, 0). Middle, comparison against baseline coactivity maps. Right, comparison against coactivity maps estimated using ripples from trials in which the participant is asked to remember the location of the preferred object of the object cell and in which the participant’s response location is outside the place field of the place cell. d, Same as in c for early retrieval-related hippocampal ripples. e, Same as in c for late retrieval-related hippocampal ripples. f, Coactivity maps estimated using all ripples from the re-encoding periods, considering only trials in which the participant is asked to re-encode the correct location of the preferred object of the object cell and in which the object’s correct location is inside the place cell’s place field. Left, comparison of the coactivity maps against chance (that is, 0). Middle, comparison against baseline coactivity maps. Right, comparison against coactivity maps estimated using ripples from trials in which the participant is asked to re-encode the location of the preferred object of the object cell and in which the object’s correct location is outside the place cell’s place field. g, Same as in f for early re-encoding-related hippocampal ripples. h, Same as in f for late re-encoding-related hippocampal ripples. White lines in c–h delineate significant clusters based on one-sided cluster-based permutation tests, which control for multiple comparisons and whose P values are stated at the upper left (see the main text and Supplementary Table 2 for Bonferroni-corrected P values). AMY, amygdala; FG, fusiform gyrus; pref., preferred.

