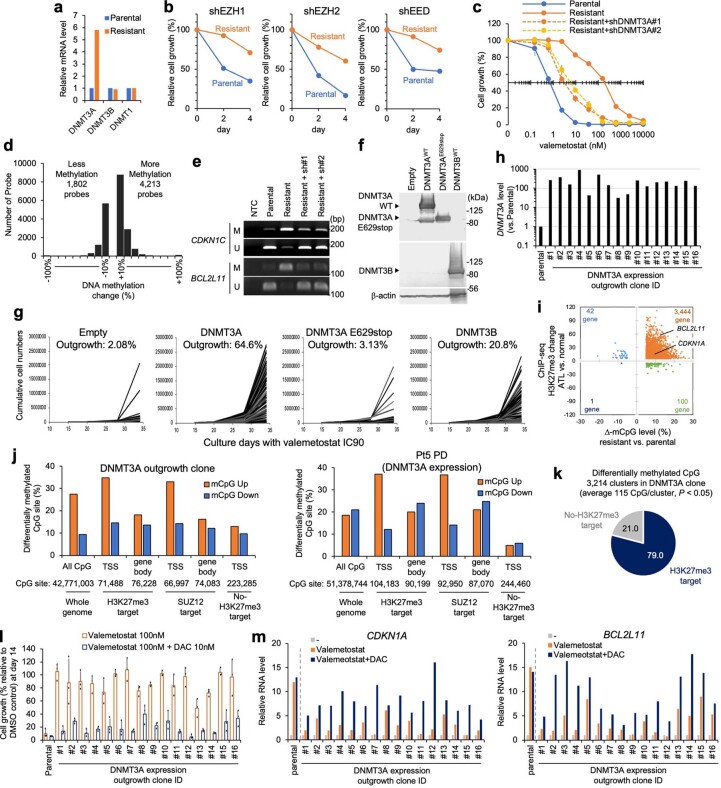
Extended Data Fig. 9. Establishment and characterization of DNMT3A-dependent valemetostat resistant models.
a, Relative expression levels of DNMT family genes in TL-Om1 parental and valemetostat-resistant cells quantified by qRT-PCR. b, shRNA targeting EZH1, EZH2, or EED were introduced by lentivirus vectors in parental and resistant cell line (TL-Om1_R). Graphs show cell growth (%) relative to control shRNA. c, Growth inhibition rate (%) by valemetostat (0 ~ 10,000 nM) in TL-Om1 parental and valemetostat-resistant cells. shRNA targeting DNMT3A or DNMT3B were transduced by lentivirus vector. n = 3, independent experiments, mean ± SD. d, Histograms show differentially methylated (ΔmCpG <−10%, or > 10%) probes in resistant TL-Om1 versus parental cells. e, MSP assay in TL-Om1_R with shDNMT3A. Amplified DNA was visualized by agarose gel electrophoresis for TSG loci with primer sets specific for methylated state (M) or unmethylated state (U). Data are representative of two independent experiments. f, DNMT3A (WT and E629stop which lacks enzymatic domain) and DNMT3B expressing cell models were established by lentivirus vectors in ATL-derived TL-Om1 and ATN-1 cells and DLBCL-derived WSU-DLCL2 cells. DNMT3A and DNMT3B protein levels were analyzed by immunoblotting (ATN-1). Data are representative of two independent experiments. g, Cell growth curves show recovered outgrowth cell numbers in ATN-1 cells in 96-well plate culture. h, DNMT3A RNA level in randomly collected outgrowth clones (n = 16) quantified by qRT-PCR. i, Scatter plot shows DNA methylation changes (x-axis) and accumulation of H3K27me3 (y-axis) in the promoter proximal region (TSS ± 1 kbp) of each gene in the outgrowth DNMT3A clone #1. Values are averaged per gene and represented only differentially methylated genes (ΔmCpG < −5% or >5%). j, Bar graphs show differentially methylated CpG sites in DNMT3A outgrowth clone (left) and Pt5 PD clone (right) in single nucleotide resolution analysis using EM-seq data. Percentages were compiled from all CpG sites (filter depth > 5) in the TSS and downstream gene body regions (center ± 1 kbp). Target genes were defined based on H3K27me3, SUZ12, and H3K27ac ChIP-seq data. k, Pie chart shows the percentage of epigenomic domains of CpG islands near the TSS with increased methylation (P < 0.05). l, m, Parental cells and the recovered outgrowth clones were treated with valemetostat (100 nM) and DAC (10 nM). Bar graphs show relative cell growth at 14 days (l, n = 3, independent experiments, mean ± SD) and relative expression levels of the H3K27me3 target genes (CDKN1A and BCL2L11) at 7 days (m). Statistics and reproducibility are described in Methods. For gel source data, see Supplementary Fig. 1.

